4-2.Data logging
1. Start up the Exclusive Monitoring Software.
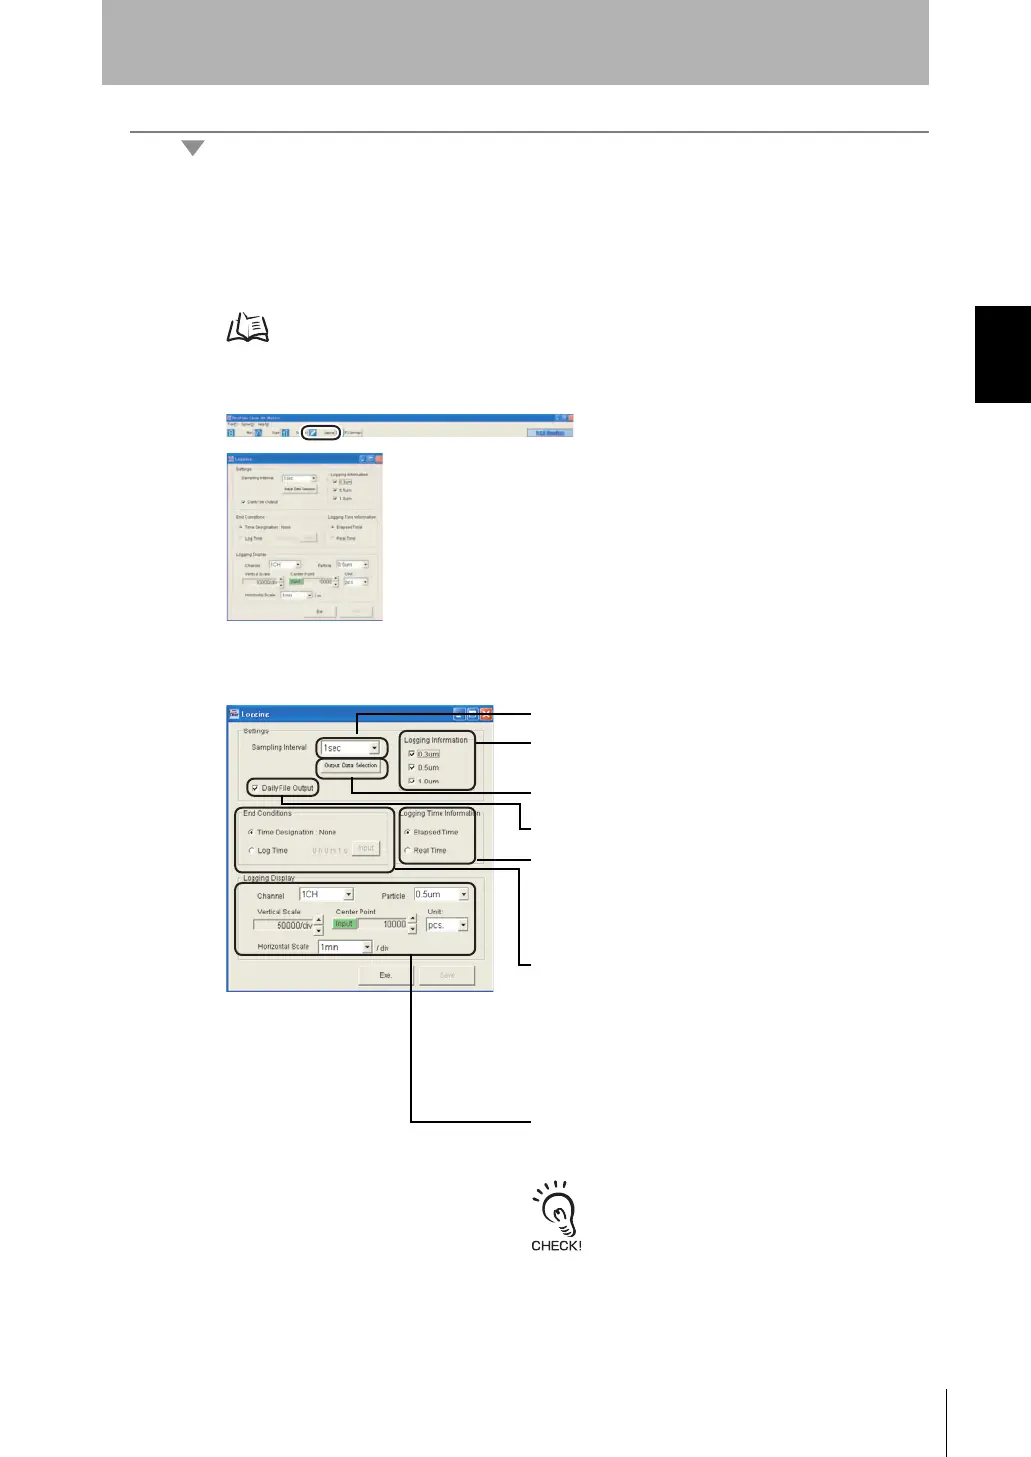
2. Click the [Logging] button to display the Logging screen.
3. In the Logging screen, set the logging conditions.
Select the time data display method that is saved at the
same time as the data when performing logging.
Elapsed Time:The elapsed time is saved as the data
starting from the logging start time.
Real Time: The actual time is saved as data.
Select the particle size to be saved.
(Multiple selections are allowed.)
Select the channel and particle size to be drawn during
logging. Also, set the horizontal and vertical scales,
center of the vertical axis, and the display unit.
[Center Point] can be set directly by clicking
the [Input] button and entering a value.
The unit selected at [Unit] is also reflected in
the unit in the graph plane.
Select the sampling interval at which data is to be logged.
Click the [Output Data Selection] button to select the channel
to output data from in the output channel selection screen.
Select the logging end conditions.
Time Designation: None:
Logging is continued until it is
ended manually.
Log Time: Set the time up to when logging
ends after the [Input] button is
clicked. When the time set here has
elapsed, logging automatically ends.
(A time up to 24 hours can be set.)
When this item is selected, a logging file is
automatically created and saved at each new day.
 Loading...