25
ZN
System Manual
Section 2 UPGRADING THE SYSTEM
Section 2
Setup Methods Suited to Specific Applications
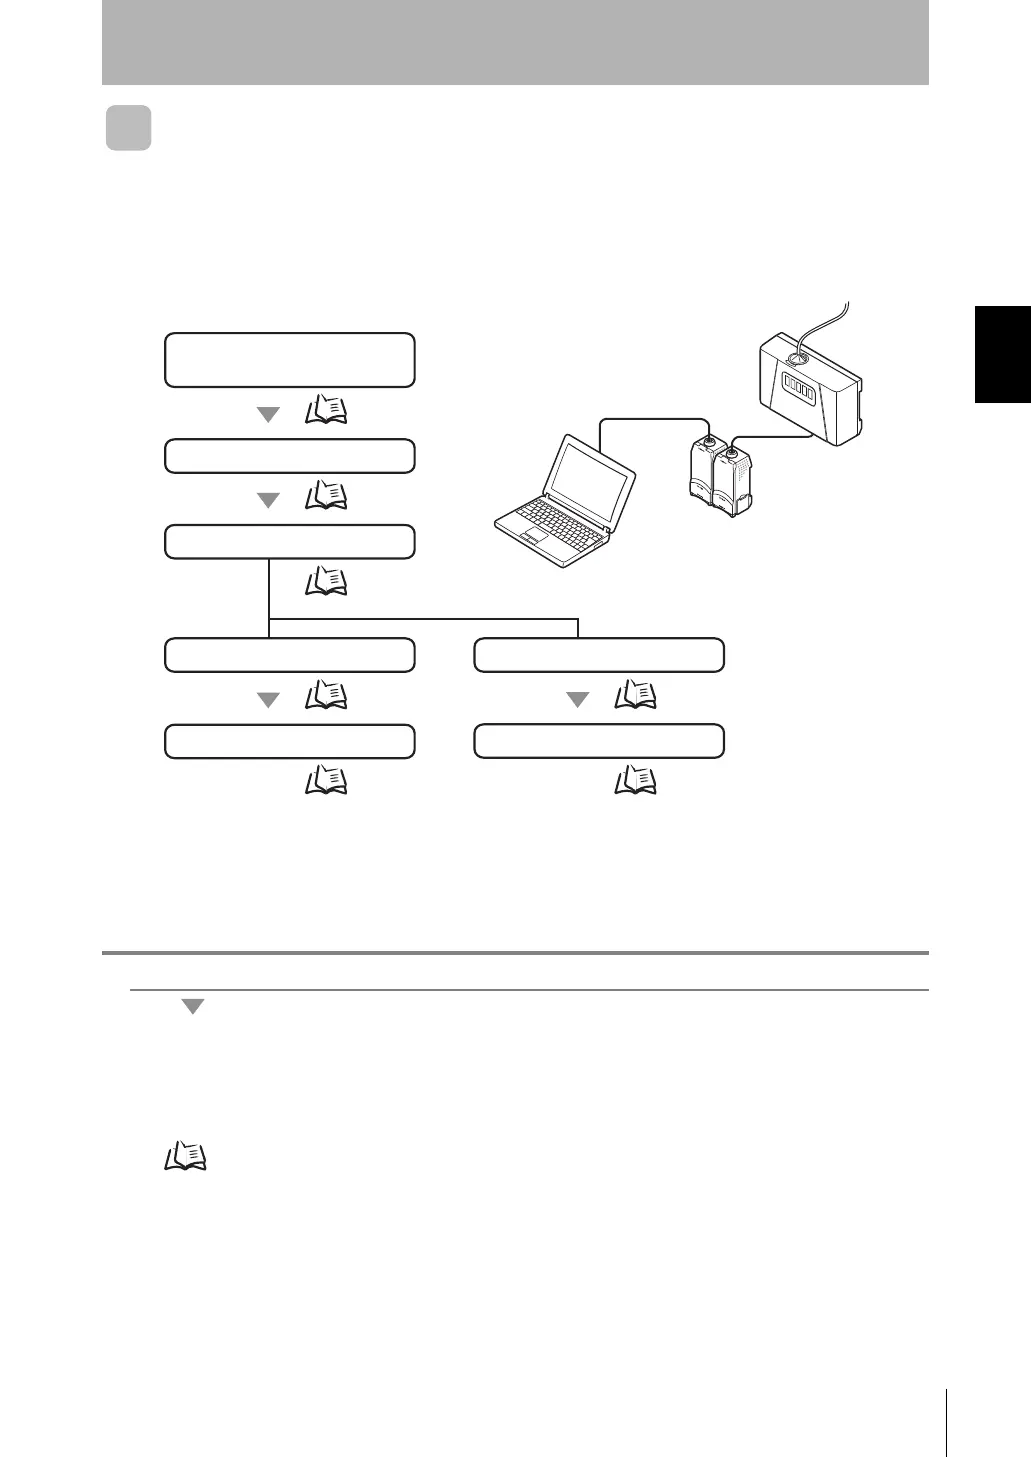
Monitoring/Logging the Amount of Particles
Measured particle values can be easily captured on a personal computer by using an
Interface Unit (sold separately) and the Exclusive Monitoring Software.
The following describes an example where the amount of particles is displayed as a
trend graph and is saved as data.
1. Installing the Exclusive Monitoring Software
Install the software (exclusive monitoring software) on the personal computer beforehand.
Installing the Exclusive Monitoring Software p.15
OPE1
OPE2
OPE3
3. Checking system operation
p.26
p.26
4-1. Displaying trend graphs
1. Installing the Exclusive
Monitoring Software
p.27
5-1. Starting monitoring
p.28
p.25
2. Connecting peripheral devices
4-2. Data logging
p.29
5-2. Starting logging
p.30
2sysup.fm25ページ2007年6月28日 木曜日 午前9時17分
 Loading...