28
Section 2 UPGRADING THE SYSTEM
ZN
System Manual
Section 2
Setup Methods Suited to Specific Applications
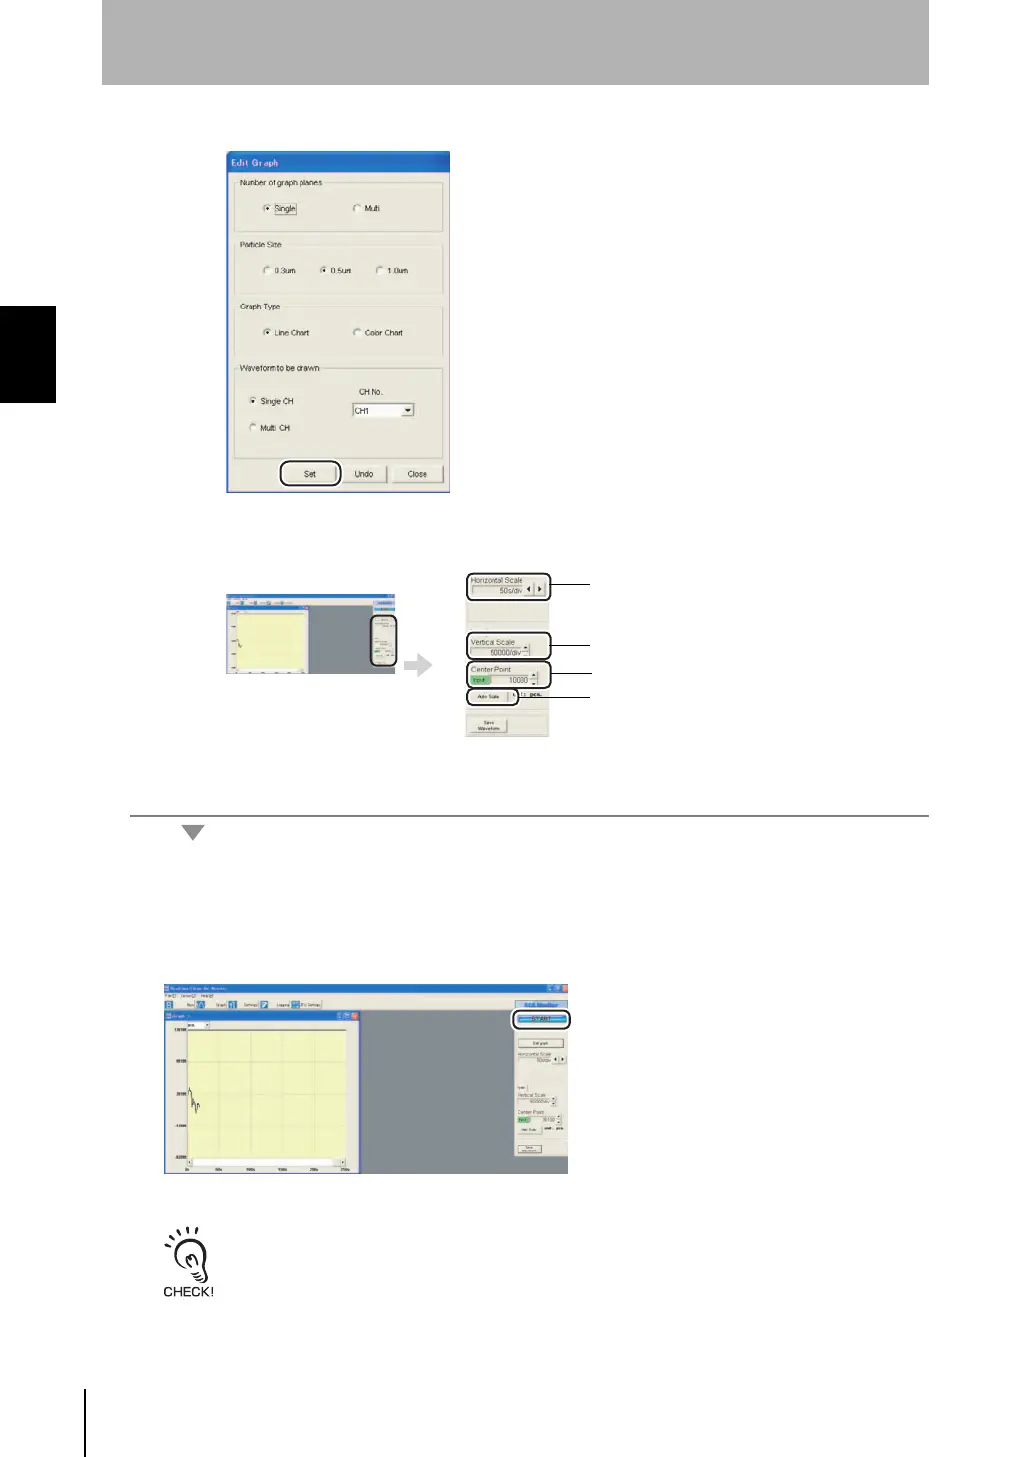
4. Click the [Set] button.
5. Align the scales of the horizontal and vertical axes.
5-1.Starting monitoring
Click the [START] button to start drawing the graph.
To stop drawing the graph, click the [STOP] button.
To save waveform data, click the [Save Waveform] button. (Data is saved in CSV format.)
The data for up to five planes including past data can be saved.
Sets the scale of the vertical axis.
Sets the value at the center of the vertical scale.
Sets the vertical axis to a scale that allows all
waveforms to be displayed.
Sets the scale of the horizontal axis.
2sysup.fm28ページ2007年6月28日 木曜日 午前9時17分
 Loading...