27
ZN
System Manual
Section 2 UPGRADING THE SYSTEM
Section 2
Setup Methods Suited to Specific Applications
4-1.Displaying trend graphs
Display the amount of particles as a trend graph.
1. Start up Exclusive Monitoring Software.
Starting Up the Exclusive Monitoring Software p.17
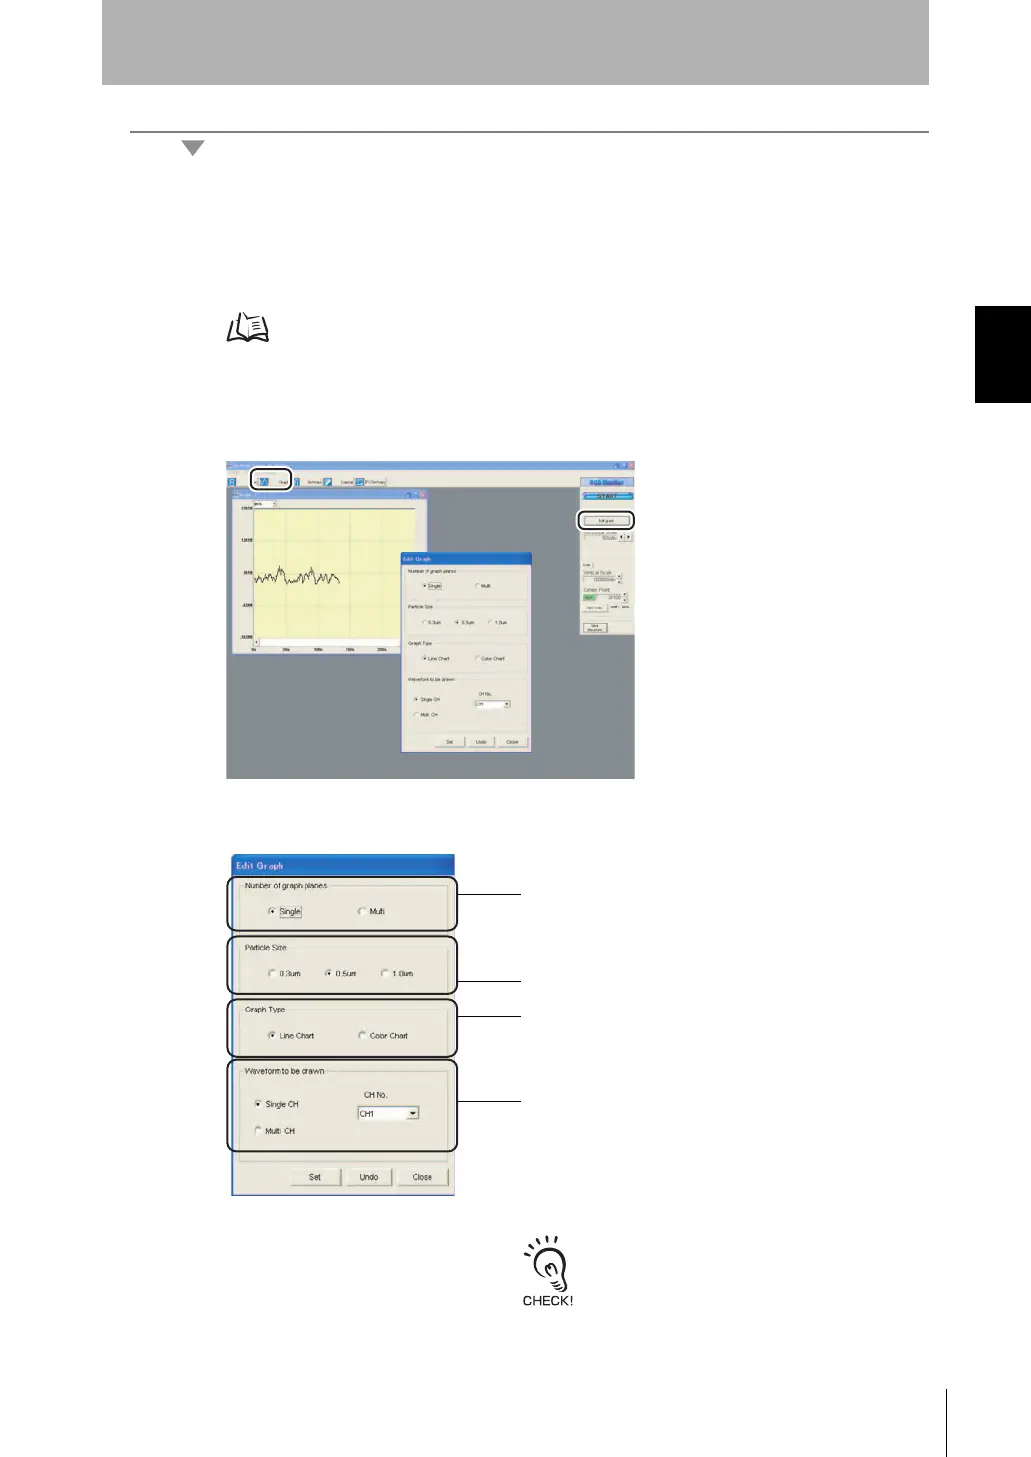
2. Click the [Graph] button and then [Edit graph] button to display the Edit Graph
screen.
3. In the Edit Graph screen, set the graph drawing conditions.
Select the number of planes to draw graphs in.
Single:All channels to be drawn as a waveform are
drawn in a single graph plane.
Multi: One waveform is drawn in one graph plane.
Select the type of the graph.
Line Chart: Displays the minimum and maximum
values within a specific time period.
Color Chart: The current value is displayed color-coded.
Select the channel No. to be drawn as a waveform.
Single CH: Select this item to draw only a specific
channel No.
Multi CH: Select this item to draw multiple channel Nos.
simultaneously.
CH No.: Select the channel No. to be drawn.
Up to five waveforms can be drawn
simultaneously.
Select the particle size to be drawn as a waveform.
2sysup.fm27ページ2007年6月28日 木曜日 午前9時17分
 Loading...