Installer Manual 255/LOGIX 742-762-764 - Description
Ref. MKT-IM-021 / A - 20.02.2019 15 / 92
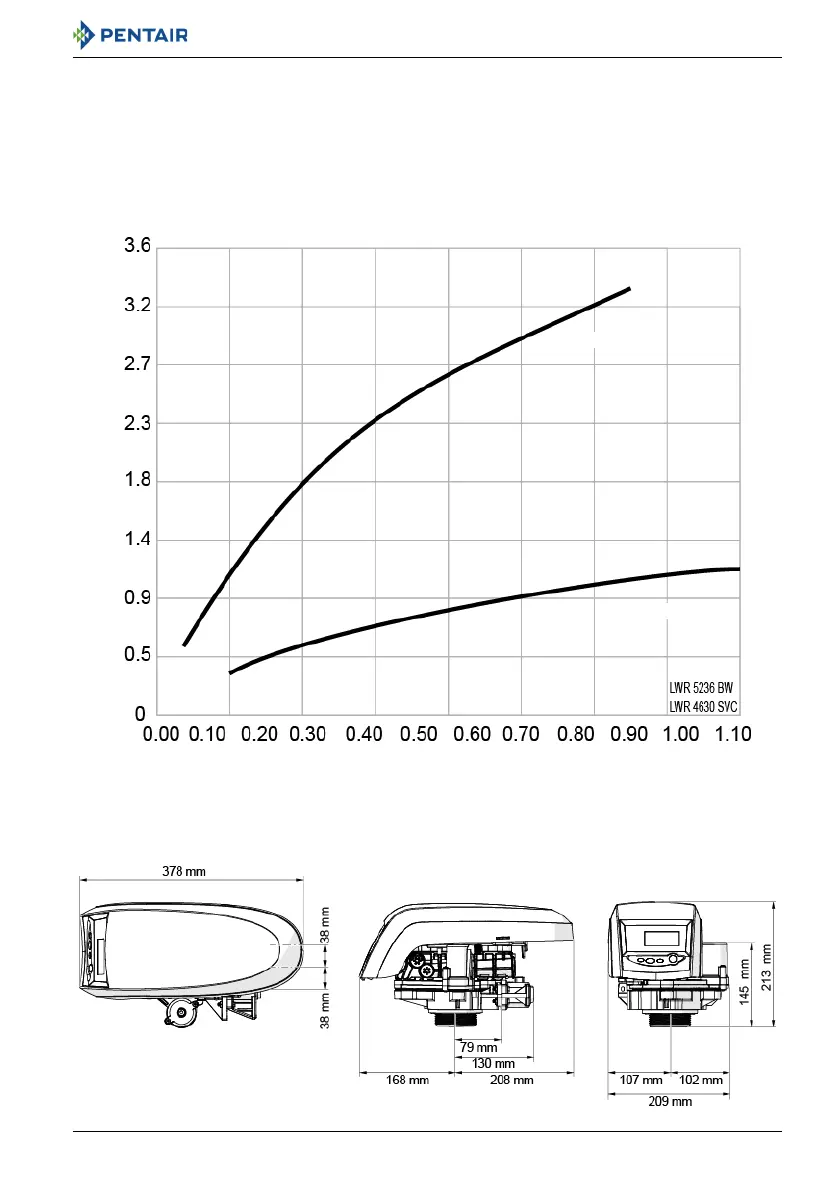
3.1.1. Performance flow rate characteristics (single valve)
The graph shows the pressure drop created by the valve itself at different flow rates. It makes it
possible to predetermine the maximum flow rate going through the valve depending on the system
settings (inlet pressure etc). It also makes it possible to determine the valve pressure drop at a given
flow rate, and therefore to evaluate the system pressure drop vs flow rate.
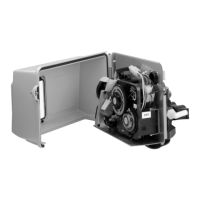
3.2. Outline drawing
Flow rate (m
3
/h)
Pressure drop (bar)
Backwash
Service
FLOW RATE VS PRESSURE DROP
 Loading...