2020-11
32
UC***-18GS series
Configuration and Analysis with DTM via IO-Link
Menu Description
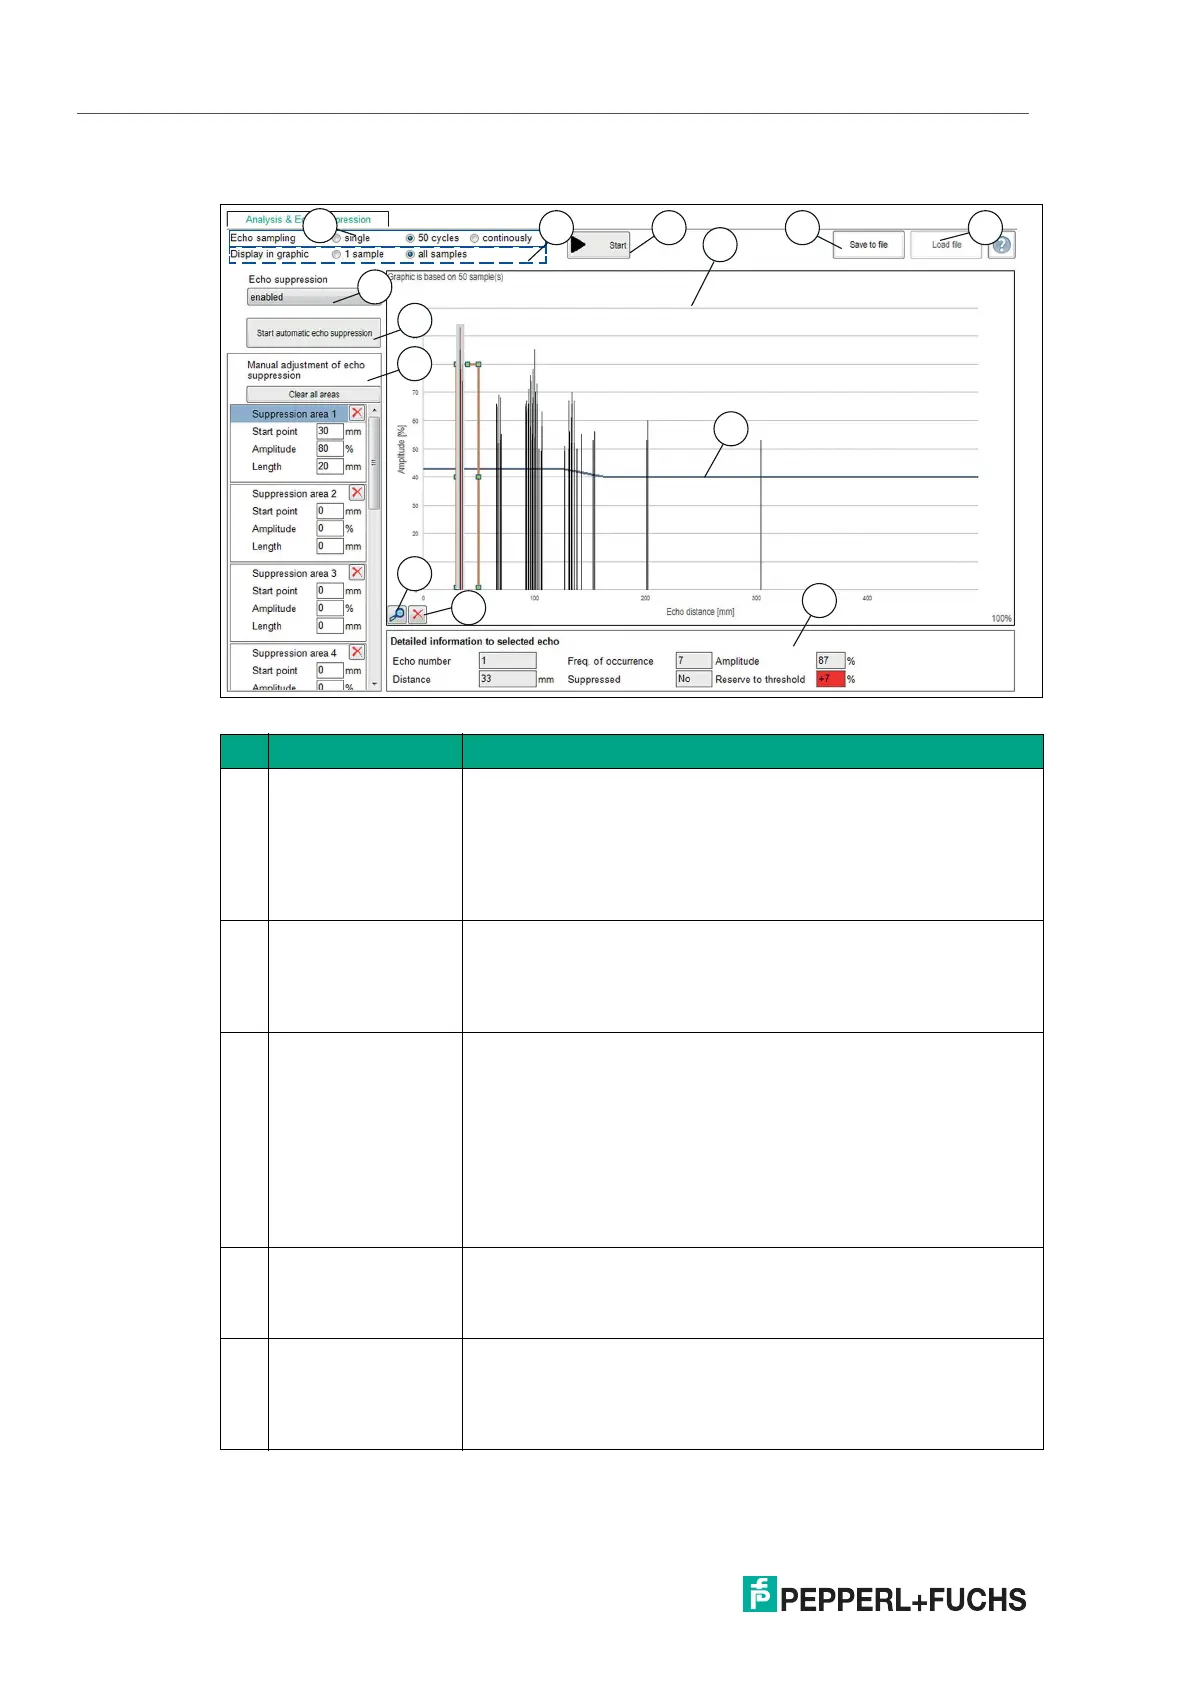
Figure 7.10
No. Name Description
1 Echo sampling In the "Echo sampling" area, you can choose whether to record a
single value, 50 values or continuous data.
Using the continuous display also provides you with an alignment
aid. You can use the displayed amplitude of the evaluated echo to
check whether the sensor is optimally aligned to the object. You
will know this has worked when slightly varying the alignment no
longer increases the displayed echo amplitude.
2 Display in graphic You can use the "Display in graphic" area to set whether all of the
gathered recorded echoes are shown or only the last recorded
echo image. The former is recommended if you want to set sup-
pression areas in an application; the latter in order to verify
detected suppression areas.
3 Start The "Start" button is used to start and stop echo sampling. After
echo sampling has started, the button changes to "Stop."
• In the case of "individual" echo sampling, echo sampling stops
after one measurement.
• In the case of "50 values" echo sampling, echo sampling auto-
matically stops after 50 measurements. You can stop it at any
time by pressing the button.
• In the case of "continuous" echo sampling, echoes will con-
tinue to be sampled until you press the button again.
4 Display area The sampled echoes are displayed in the form of thin columns
during and after completion of echo sampling.
The counter in the upper left corner indicates the number of echo
samples the current graphic is based on.
5 Save to file You can save the echo sample, including set suppression areas,
as a .CSV file, .XML file or .TXT file by pressing the "Save to file"
button. In addition to this data, sensor settings (parameter values)
will also be saved. This means it is possible to evaluate recorded
data later "offline."
 Loading...