PicoQuant GmbH HydraHarp 400 Software V. 3.0.0.1
At the beginning of each TRES run, the active curve (block) will be set to 0, or to 1 if no IRF is collected. All
curves that were previously collected and not saved to a file will be overwritten with new data. During a TRES
run, the currently collected data will always be shown as Trace 0 (dark blue), even though the block (Trace)
number is actually incremented at each wavelength step. This is to overcome the limitation of only 8 display
curves being available. You can watch the block number in the control panel to see the curve currently being
collected. Manual entry will be disabled during the run. Also, you can watch the status bar to see the current
wavelength and stepping activity. Note that for a TRES measurement the control panel setting 'Stop Of' applies
as in Integration mode, while 'Restart' is meaningless in TRES mode.
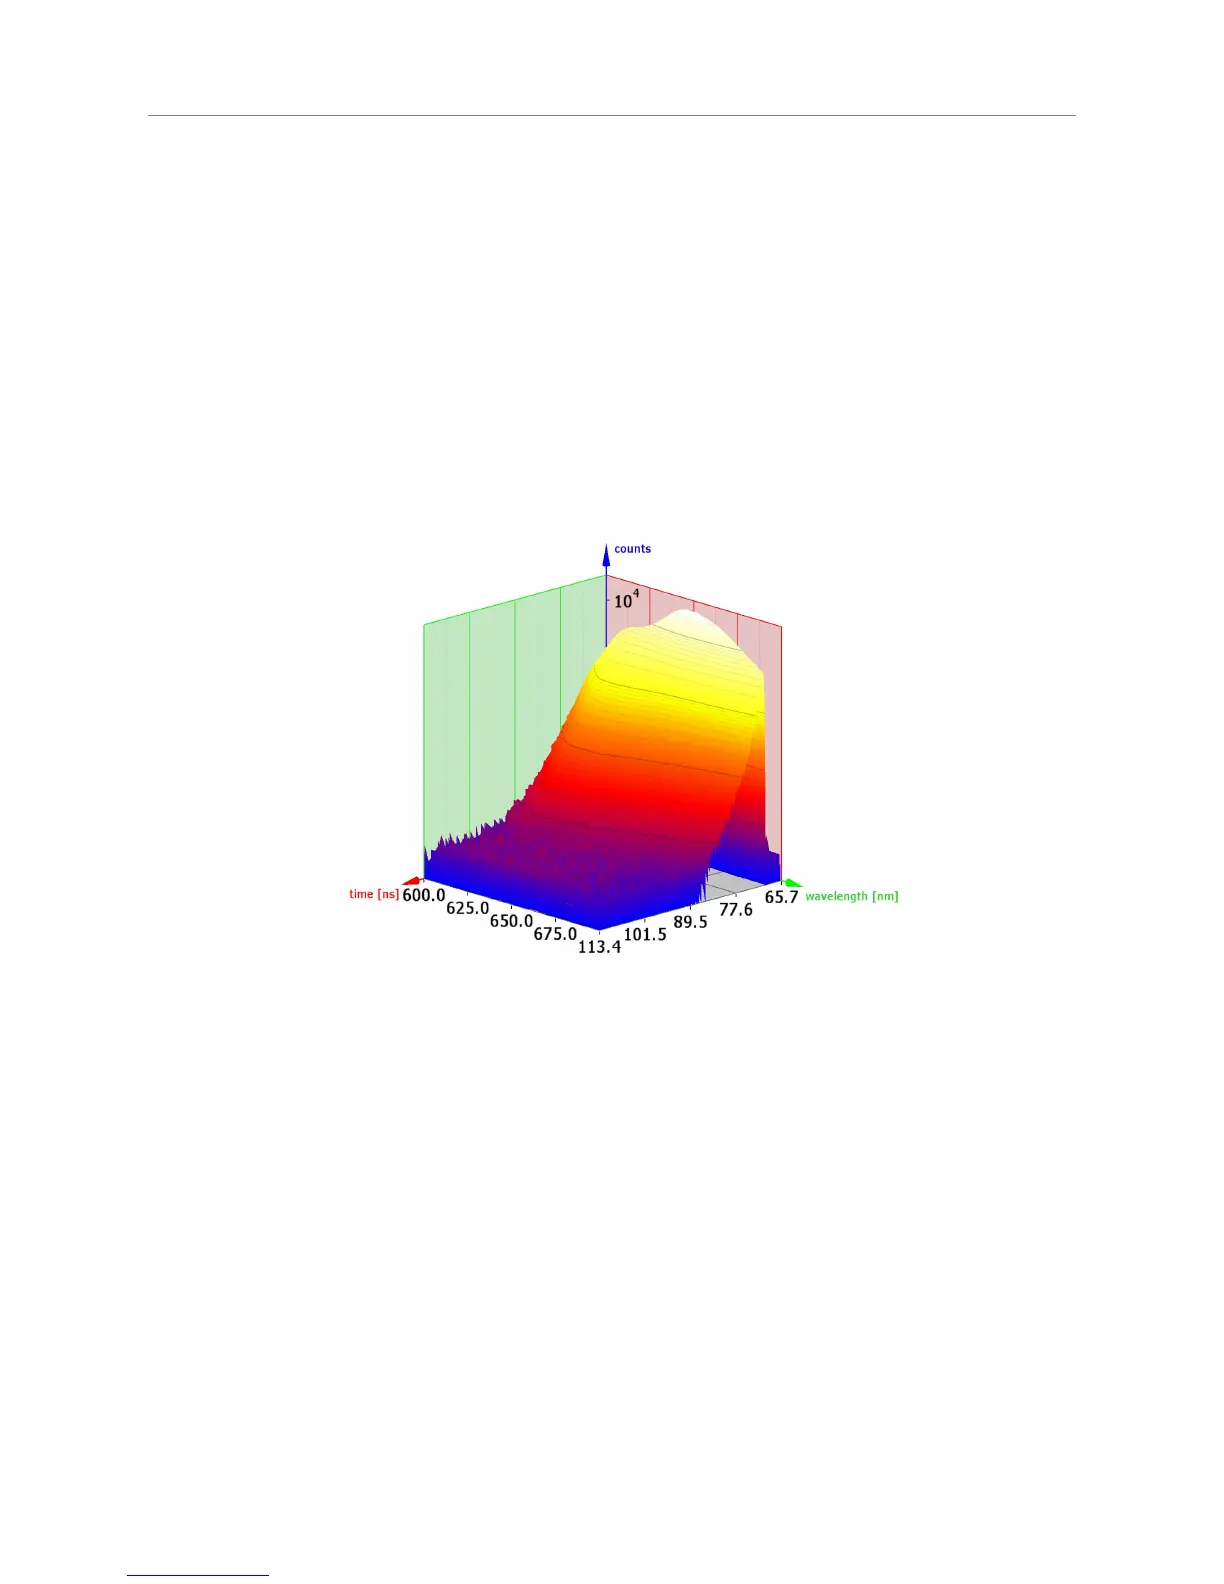
TRES Data Analysis and Visualization
Having collected a complete TRES data set you can save it to a regular *.phu file. You can also inspect
individual curves via the Trace Mapping dialog. You can furthermore use the software tool FluoPlot from
PicoQuant to visualize and analyze the data in various 2D and 3D representations with a multitude of options
for colouring, scaling and changing view aspects in 3D. The figures below show FluoPlot visualizations from a
TRES measurement of mixed oxazine dyes in ethanol.
Page 39