Page 49 of 126
Proton Products SL mini and SLR mini Series Speed and Length Gauges Instruction Manual - issue 1s
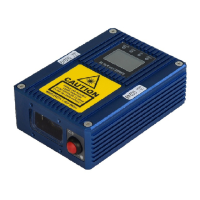
Left-side Y-axis
Click on the drop down box to select the data plotted on this axis.
Click on the coloured box to select the line colour.
Click on the drop down box to select the data plotted on this axis.
Click on the coloured box to select the line colour.
Click to allow the software to automatically set the minimum and maximum values for
this axis.
Click to manually set “Maximum” and “Minimum” values for this axis.
Click to enter the maximum value for this axis.
Click to enter the minimum value for this axis.
Clicking on “Data” or colour boxes will open the colour selection dialog:
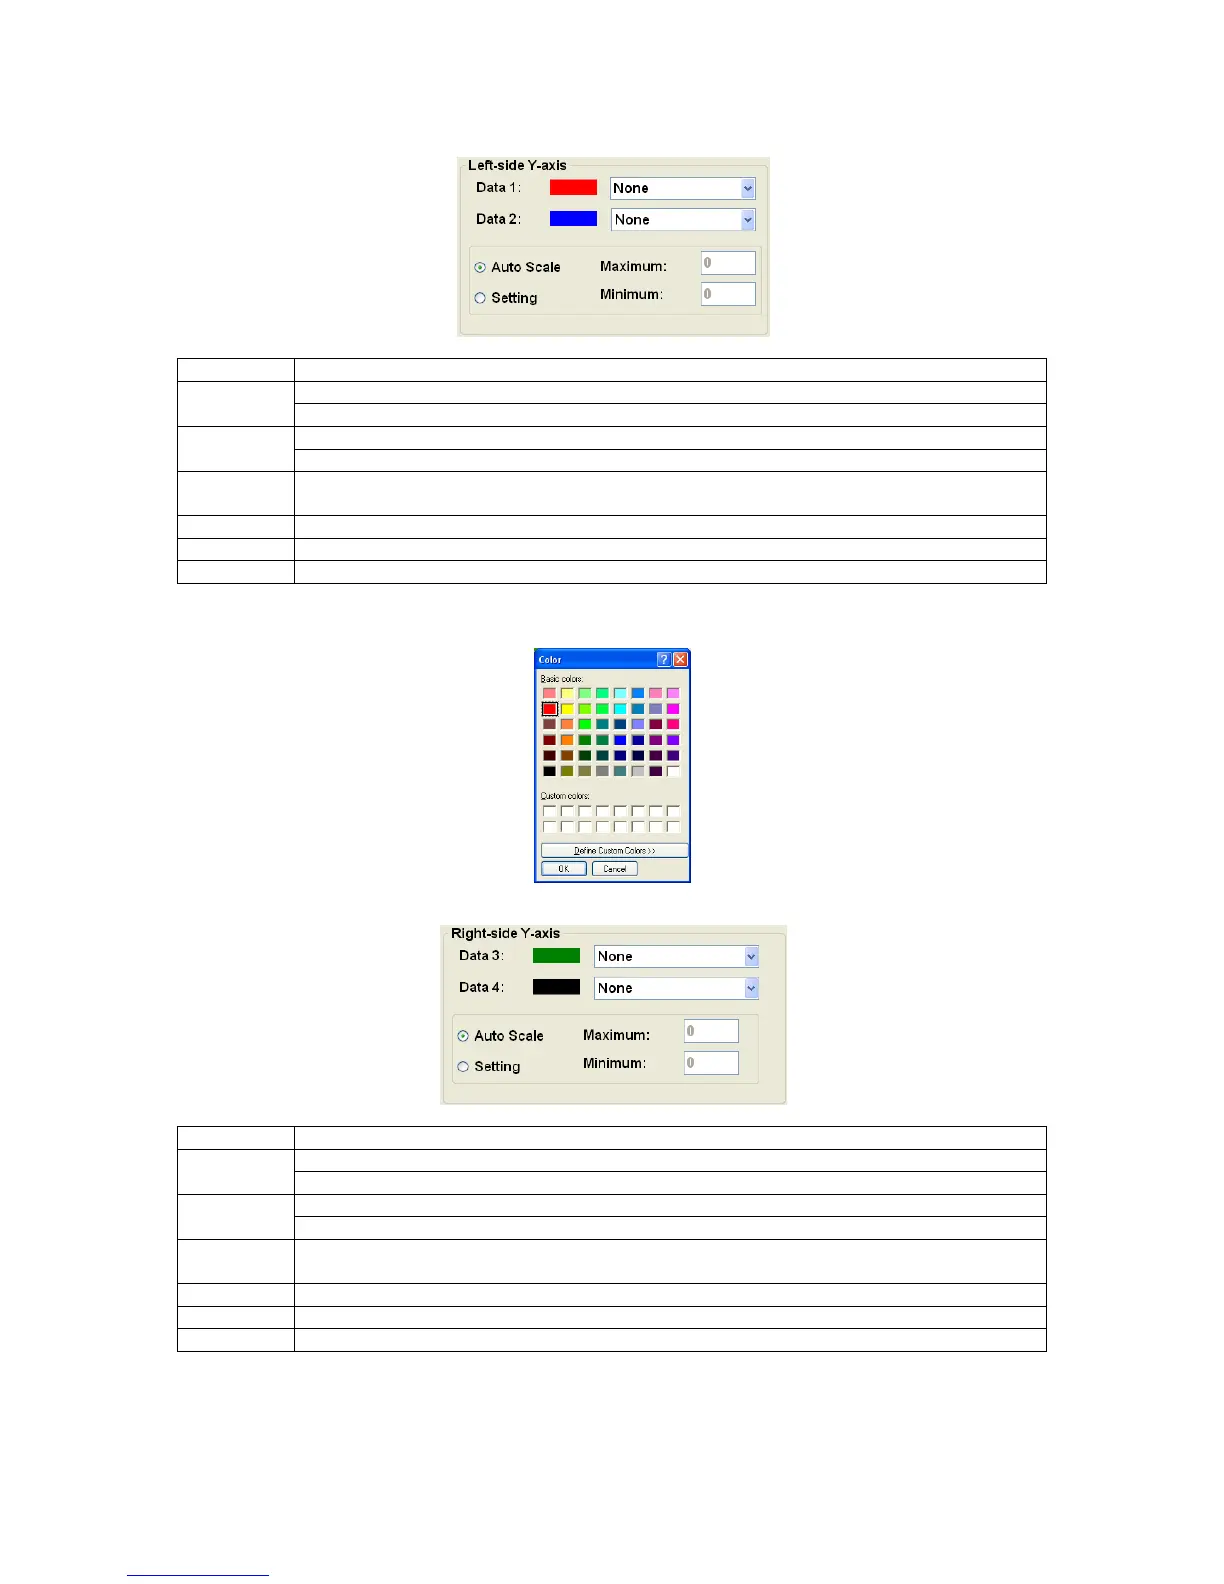
Right-side Y-axis
Click on the drop down box to select the data plotted on this axis.
Click on the coloured box to select the line colour.
Click on the drop down box to select the data plotted on this axis.
Click on the coloured box to select the line colour.
Click to allow the software to automatically set the minimum and maximum values for
this axis.
Click to manually set “Maximum” and “Minimum” values for this axis.
Click to enter the maximum value for this axis.
Click to enter the minimum value for this axis.
 Loading...