© 2021 Radiodetection Ltd 30
Fig. 7.9: Interpretation
To verify the fault location, the transmitter was repositioned
to the other end of the pipeline. Figure 7.10.
Fig. 7.10: Parallel Pipes
The following results obtained:
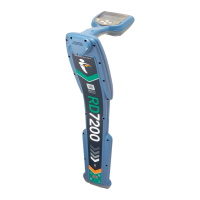
Section A Good Peak and Null locate, reading decreasing
at a steady rate.
Section B Poor peak and Null locate with a sharp fall
in current reading.
Section C Short/Contact.
The easiest path for the current to flow is down the old
discarded pipe. As this is in the opposite direction to the
flow on the new pipe it has a cancellation effect which
accounts for the sharp drop in reading.
The short would be at the point where the current drops
close to zero.
The graph in Figure 7.11 illustrates this effect.
Fig. 7.11: Interpretation
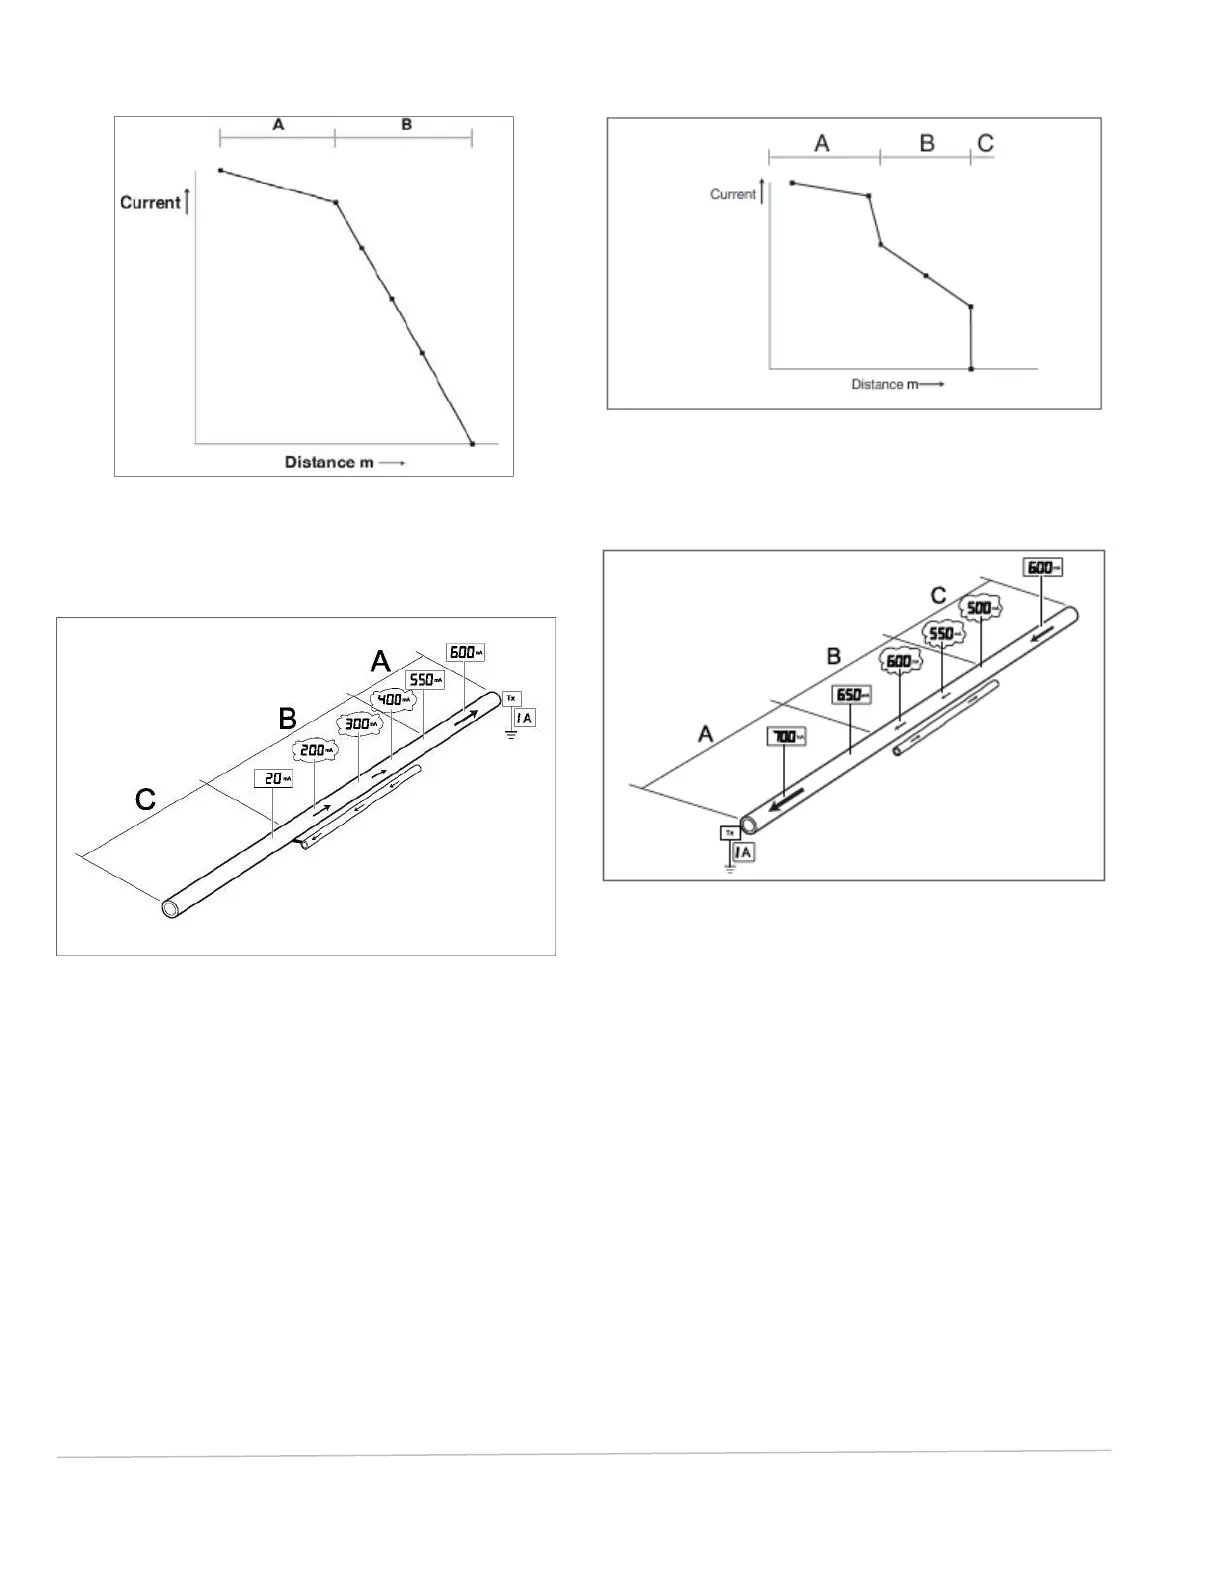
Example 2
Fig. 7.12: Parallel Pipes
This example 2 (Figure 7.12) demonstrates a typical
application where a short piece of parallel pipeline
interfered with the result.
For ease of explanation the pipeline has been divided
into three parts A, B & C.
In this situation a 1 Amp signal was applied to the new
pipeline and the direction of maximum current flow
followed.
Section A Good Peak and Null locate and a steady rate of
decrease that indicated a good coating.
Section B Poor Peak and Null locate (outside 15cm
(6 inches) requirement) and a significant drop
in current reading.
Section C Good Peak and Null locate with a rise in current
and then a steady rate of decrease.