34 • Viewing, Printing, Exporting, and Deleting Data
4. Click the expanded view symbol (+) of or double-click the
dated folder whose contents you want to see.
5. Click on the Interval Trend folder. In the upper right frame of
the Data window, a list of file names will appear in the Name
column. A prefix of “iv” indicates an interval trend data file.
6. Click one of the interval trend data file names. A summary
will appear in the bottom right frame with instrument and
alarm setting information. If you want to view, graph, print, or
export the interval trend data, double-click the filename or
click the View Data button at the bottom of the window.
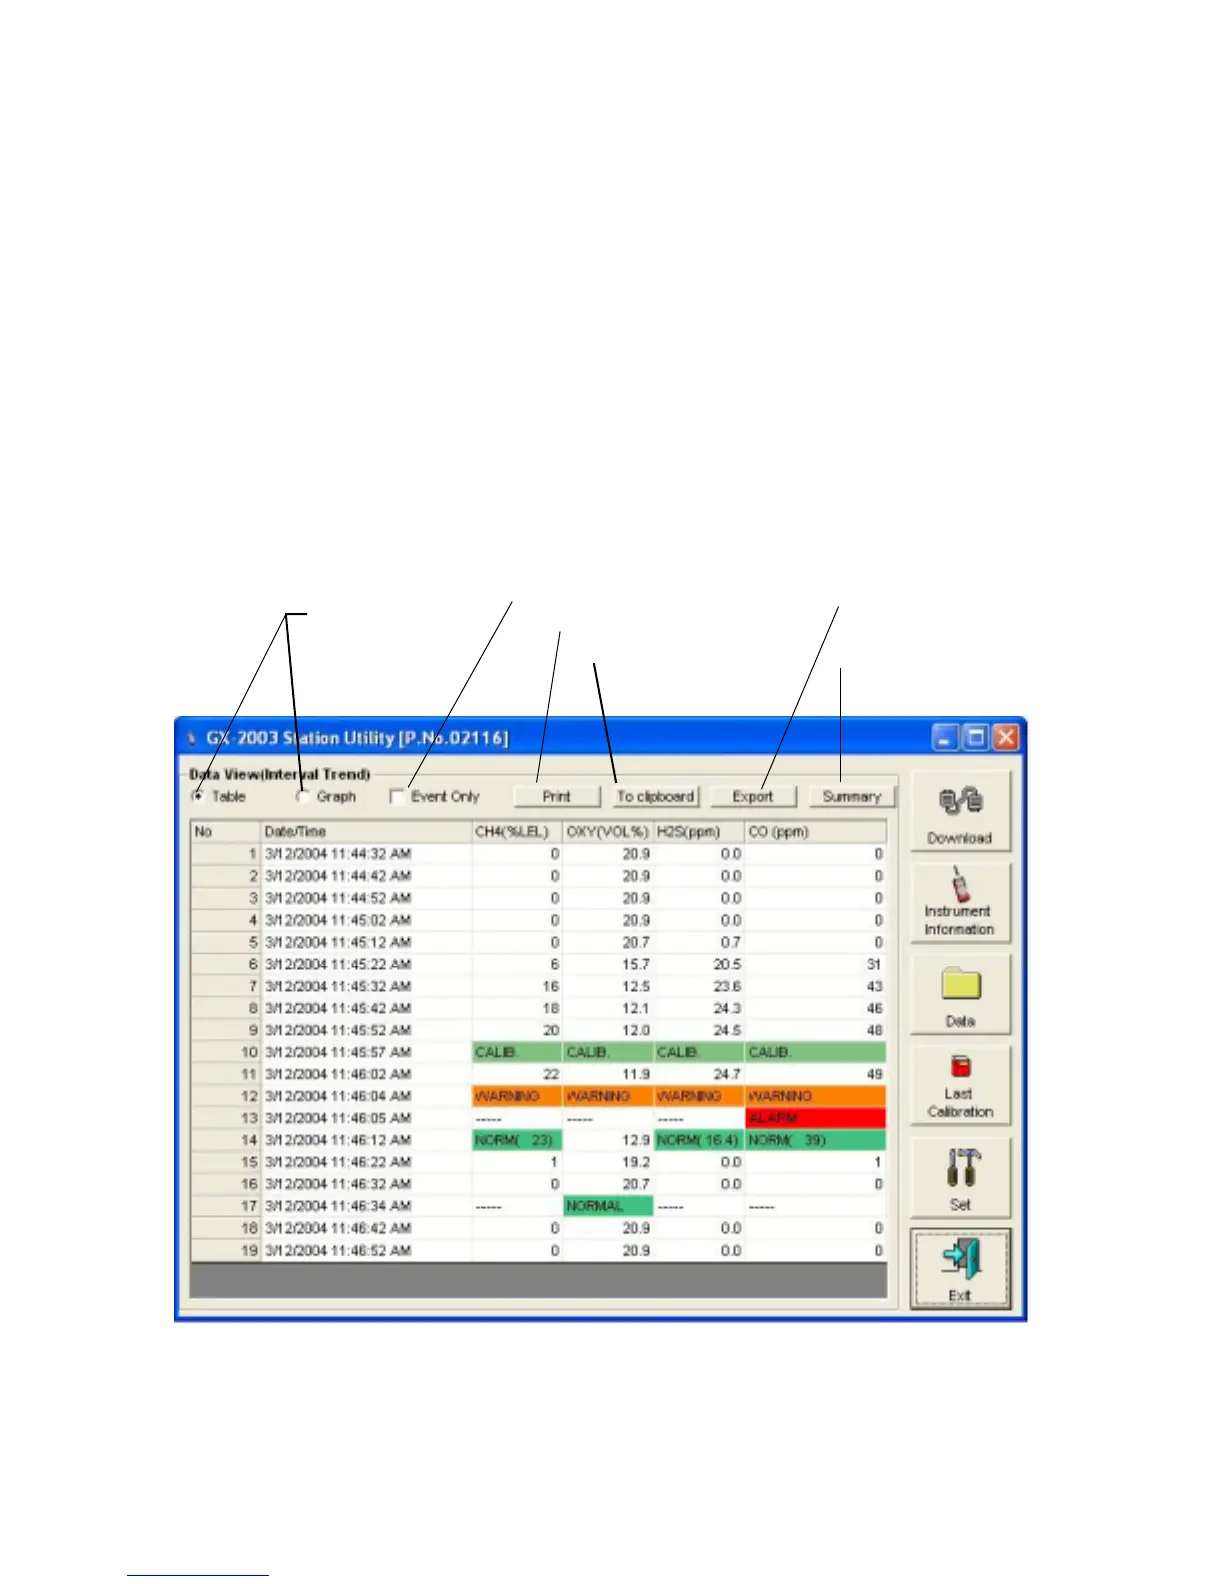
7. Interval trend data can be viewed in either table or graph
format by selecting the Table or Graph selection buttons.
• In table format, the interval trend data is shown as the
Figure 23: Interval Trend Data in Table Format
Click to print data
Click to save data
to a file
Click for a summary
of the data
Select table or
graph view
Click to see events only
Click to save data
to the Clipboard
 Loading...