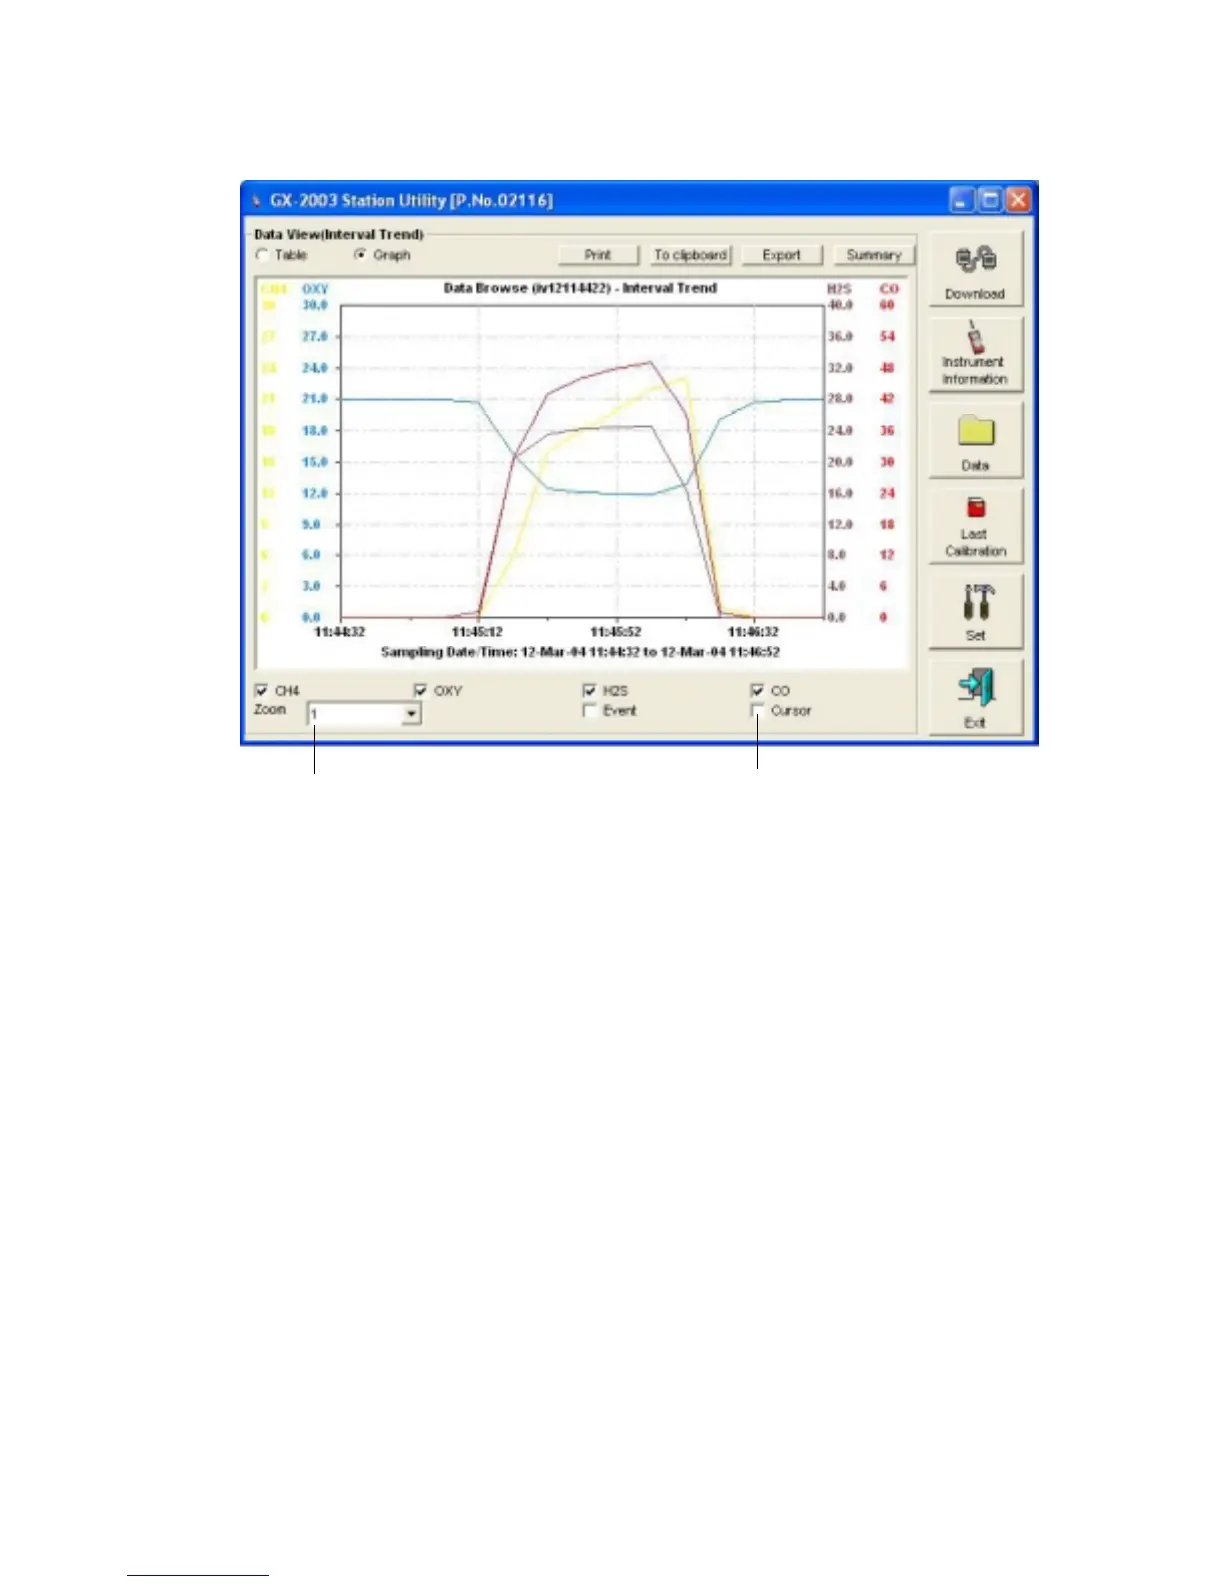
Viewing, Printing, Exporting, and Deleting Data • 37
When viewing interval trend data in graph format, you have
several options:
• You can choose which gas you want to graph
• You can choose the zoom level, or displayed time interval,
on the graph. The zoom feature shows greater detail
relative to time. Thus, the length of a time division on the
graph will depend on both the length of the datalogging
session and on the zoom factor.
• When selected, the Cursor feature allows you to display
the gas reading and log time for each data point. As you
use the left and right arrow buttons on your keyboard to
move the cursor across the graph horizontally, readings at
specific log times are displayed. Use the up and down
arrows on the keyboard to move the readings up or down
on the screen.
Figure 25: Interval Trend Data in Graph Format
Cursor feature
Zoom level

 Loading...