SP395 SoundPro Audio Integrator Form7492 Operation Manual
32
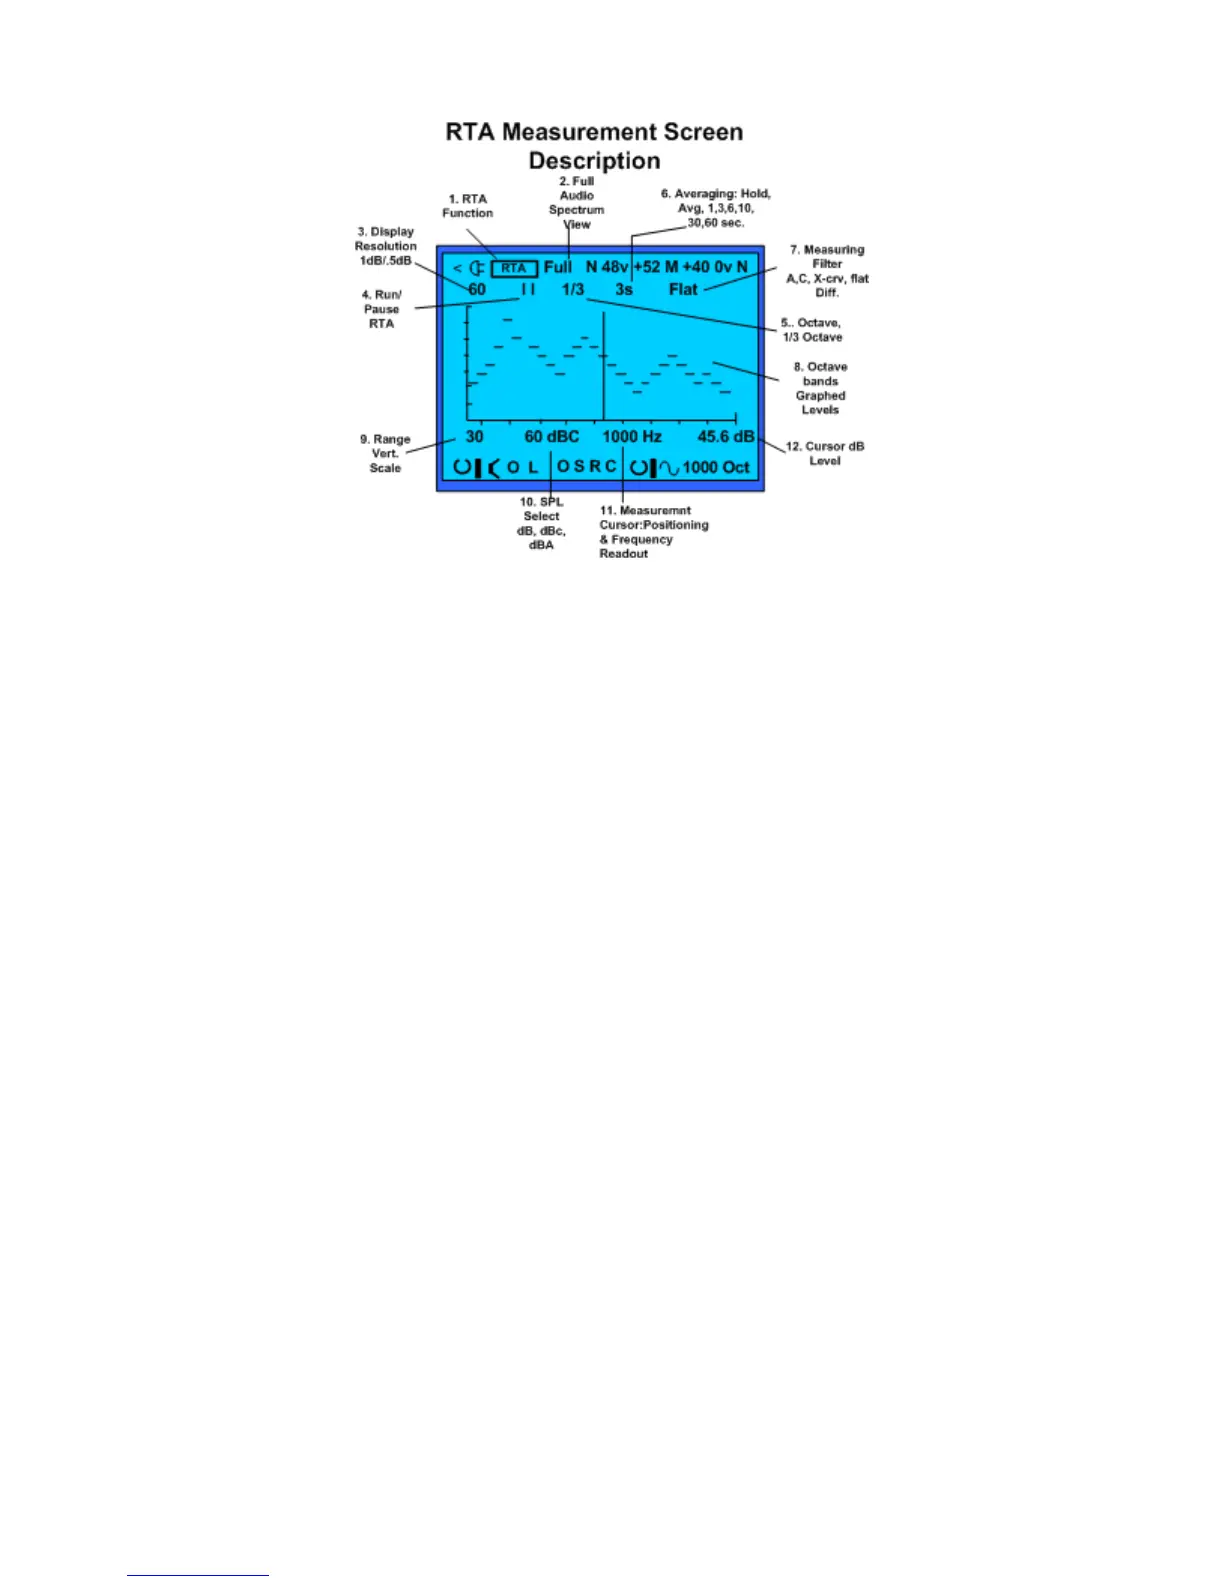
The RTA measurement test screen.
RTA Display and Controls
1. Test Function - Identifies the test function (RTA)
2. Full Bandwidth – Indicates all octave bands are graphed in the RTA. This field is not
selectable.
3. Graph Resolution - Click the dB number at the top of the left graph axis to change the
vertical graph resolution between 1 dB/pixel (30 dB range) to 0.5 dB/pixel (15 dB range).
The resolution number changes to be either 30 or 15 dB higher than the range number at
the bottom of the axis.
4. Run/Pause – Start the RTA or pause it by clicking the Run/Pause field. Pause the test to
"freeze" the displayed RTA graph so that you can easier make cursor measurements or
store the graph to memory.
5. Octave Mode – Select octave or 1/3 octave band filters, as indicated by Oct or 1/3.
6. Averaging – Select an exponential decay averaging mode with a time constant of 1, 3, 6,
10, 30 or 60 seconds; a mode that averages equally over time (cumulative); or peak hold
mode. A numeric value indicates an exponential decay mode, with a time-constant equal
to the value. Exponential decay averaging means that more recent sounds have more
bearing in the displayed average. A longer time constant produces a more stable display,
but a slower response to changing sounds. Cumulative average mode is indicated by
AVG. Peak hold mode is indicated by HLD.
7. Overlay Test Filter – Select Flat response (normal), the A or C weighting curve, or the
motion picture ANSI X-curve (PH22.202M-1984), used for setting up motion picture
theaters. Note that these overlay filters actually modify the data on the screen, unless Flat
is selected. This means that a flat input signal will show up like the A or C curve, with the
lows and highs attenuated accordingly. This can be useful in community noise studies, to
determine what frequency bands may be exceeding a standard referenced to A or C
weighting. You may also select a “Diff” (difference) mode to show the change in RTA
which occurred from a previous RTA captured into memory.
8. Graphed RTA test data – Bar graphed data.