SP395 SoundPro Audio Integrator Form7492 Operation Manual
38
Energy Time Graph
Sound travels only about 1130 feet/second. Time delays caused by even relatively short distances
can cause audible effects. An energy-time graph shows time relations between sounds.
The SP395 Energy-Time Graph (ETG) function applies an exciting pulse through an external
amplifier and speaker, and displays direct sound from the speaker, plus the energy decay of the
sound reaching the microphone. The graph represents the instantaneous SPL levels at specific
times after the exciting pulse occurs, and is calibrated vertically in dB (SPL) and horizontally in
time or distance.
Use the ETG function to measure direct sound arrival times, identify room surface reflections,
measure Initial Time Delay Gap (ITDG) to characterize room acoustics, accurately set A/V
processor time delay and to calibrate speaker time delays in sound reinforcement systems.
The energy-time graph is typically viewed at a short time/distance to check direct sound arrival
time from a speaker, identify early speaker reflections, check PA speaker phasing, or determine
ITDG; and at a long time/distance to view the room energy decay rate.
The Energy-Time Graph shows the decay pattern for sound reaching the microphone or line
input over time after a pulse has been generated and played through a speaker, or after a pulse
has been detected externally. For an internally-generated pulse, initial delay time is also shown.
The graph is calibrated in units of dB SPL vertically, and units of time horizontally. Optionally,
the graph can show units of distance on the horizontal axis.
The Energy-Time Graph can also be used to measure the reverberation decay RT60 time for a
room. RT60 is defined as the time it takes for a loud sound in a room to decay by 60dB.
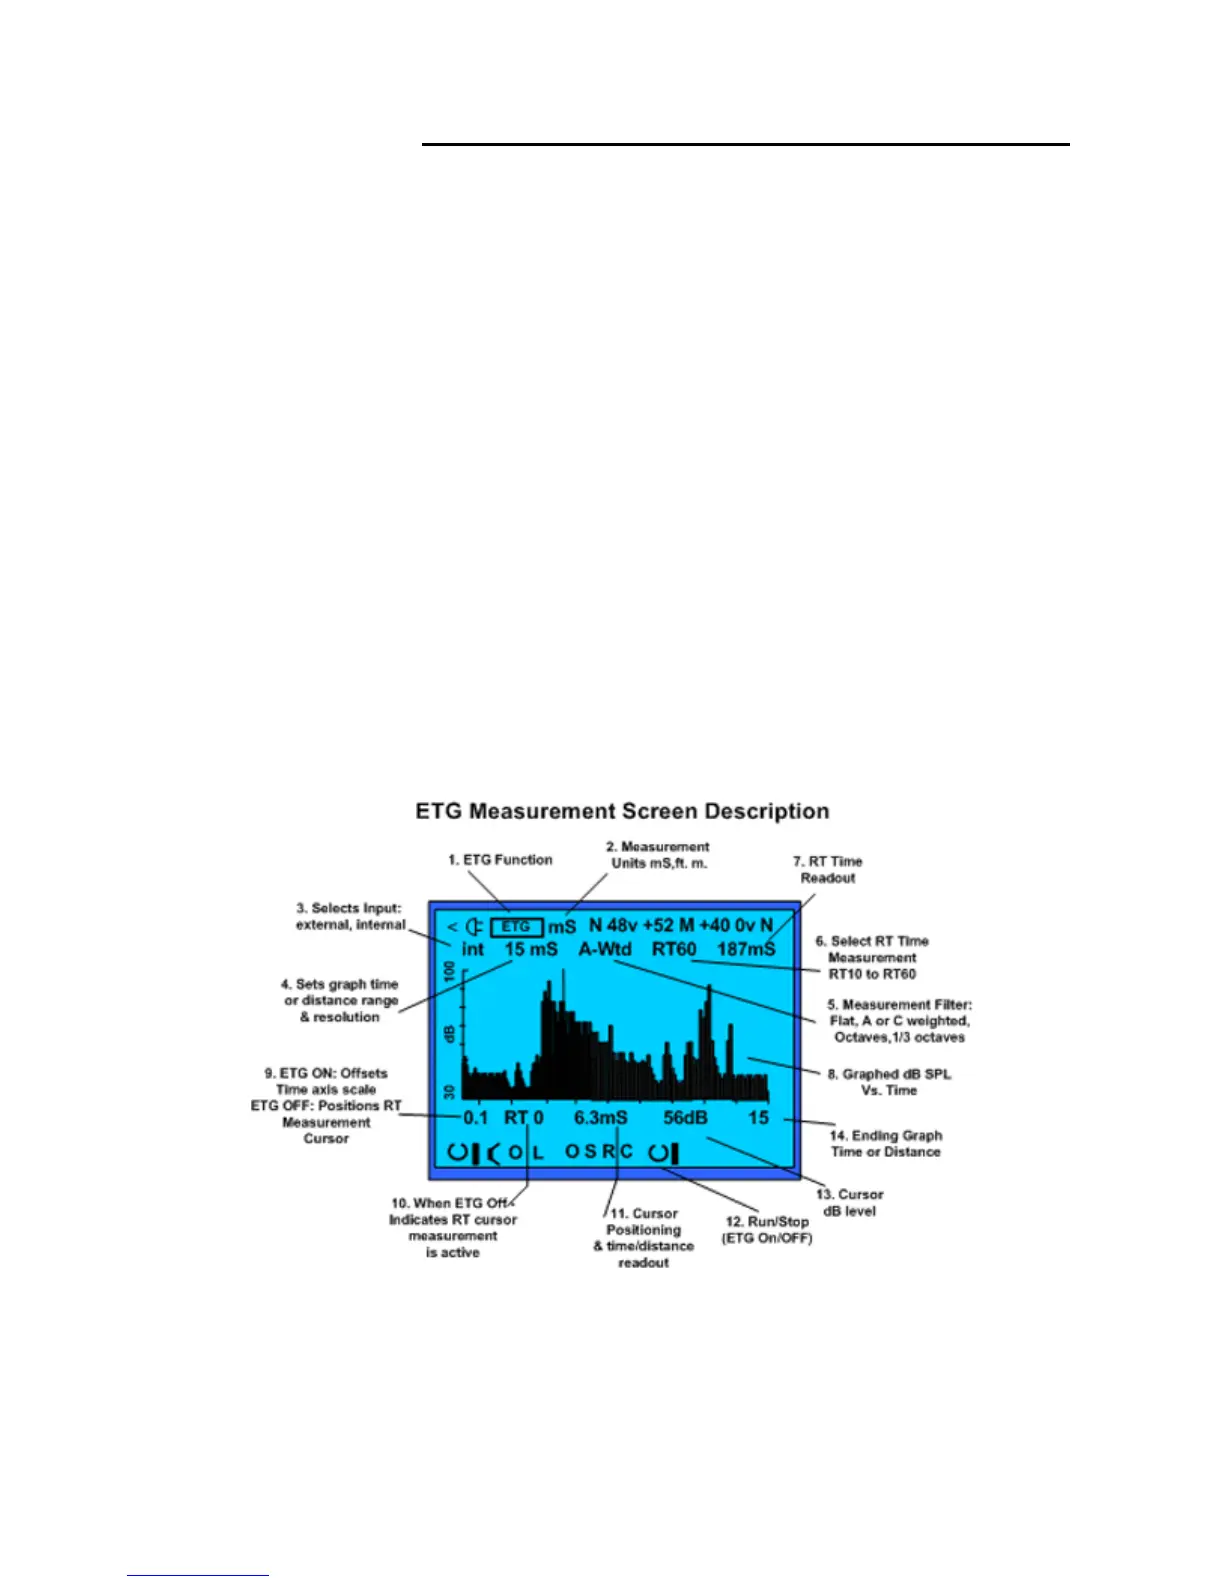
Energy Time Graph (ETG) test screen.
ETG measurement screen and control fields:
1. ETG Function – Indicates ETG test function has been selected.
2. Sound travel time or distance unit of measurement – measurement units include milli-
seconds (mS), feet (ft), or meters (m). This field controls what measurement units are
displayed along the horizontal (X) axis of the display