SP395 SoundPro Audio Integrator Form7492 Operation Manual
51
This TDA measurement method is ideal for measuring the frequency response of speakers. In
essence, TDA looks at the speaker as if it were in an anechoic chamber (ideally speaking), and
the effect of the room on the measurement is reduced. The amount of reduction depends on the
steepness of the band-pass filter and the speed of the sweep. The filter in the SP395 has variable
Q (steepness), and can be set from a Q of 6 to a Q of 150. More information about filter Q and
setting up the TDA function will be detailed below.
Room Response
An interesting thing happens if the filter sweep is delayed from the generator sweep by more
than the Ts time. Say, for example, that the microphone was 8 feet from the speaker. With a
speed of sound in air of 1130 ft/s, the time for sound to travel from the speaker to the
microphone (Ts) is 0.007 seconds, or 7 mS. If we add 100 mS to the Ts time, for example,
delaying the input filter sweep by 107 seconds from the generator output, the resulting graph
shows the level of the swept sine wave 100 mS after it is first produced at the loudspeaker. We
see the level of each frequency in the swept sine wave after 100 mS of decay in the room. To see
the decay at any other time, just add that time to Ts and run the sweep.
Say now that we run 10 sweeps, each with a 50 mS greater delay. If the resulting 10 graphs are
plotted in 3D, side by side, we get a good picture of the decay pattern of the room, by frequency,
over 500 mS of time. Room modes appear as ridges that remain at a higher level after other
frequencies have decayed. This multiple set of time-delayed graphs, showing us the room
response over time, is sometimes called a 3D waterfall graph.
TDA Parameters
The SP395’s TDA function has great flexibility. You can set the distance from the microphone to
the speaker (Initial Delay), the time for each sweep, the additional delay time between
consecutive sweeps (Sweep Delta), the number of sweeps to run, and the Q of the filter. You can
run the selected sweeps, page back and forth through the resulting graphs, use the measurement
cursor to inspect data points on the graphs, and store the graphs to the internal memories at a
specified starting memory number.
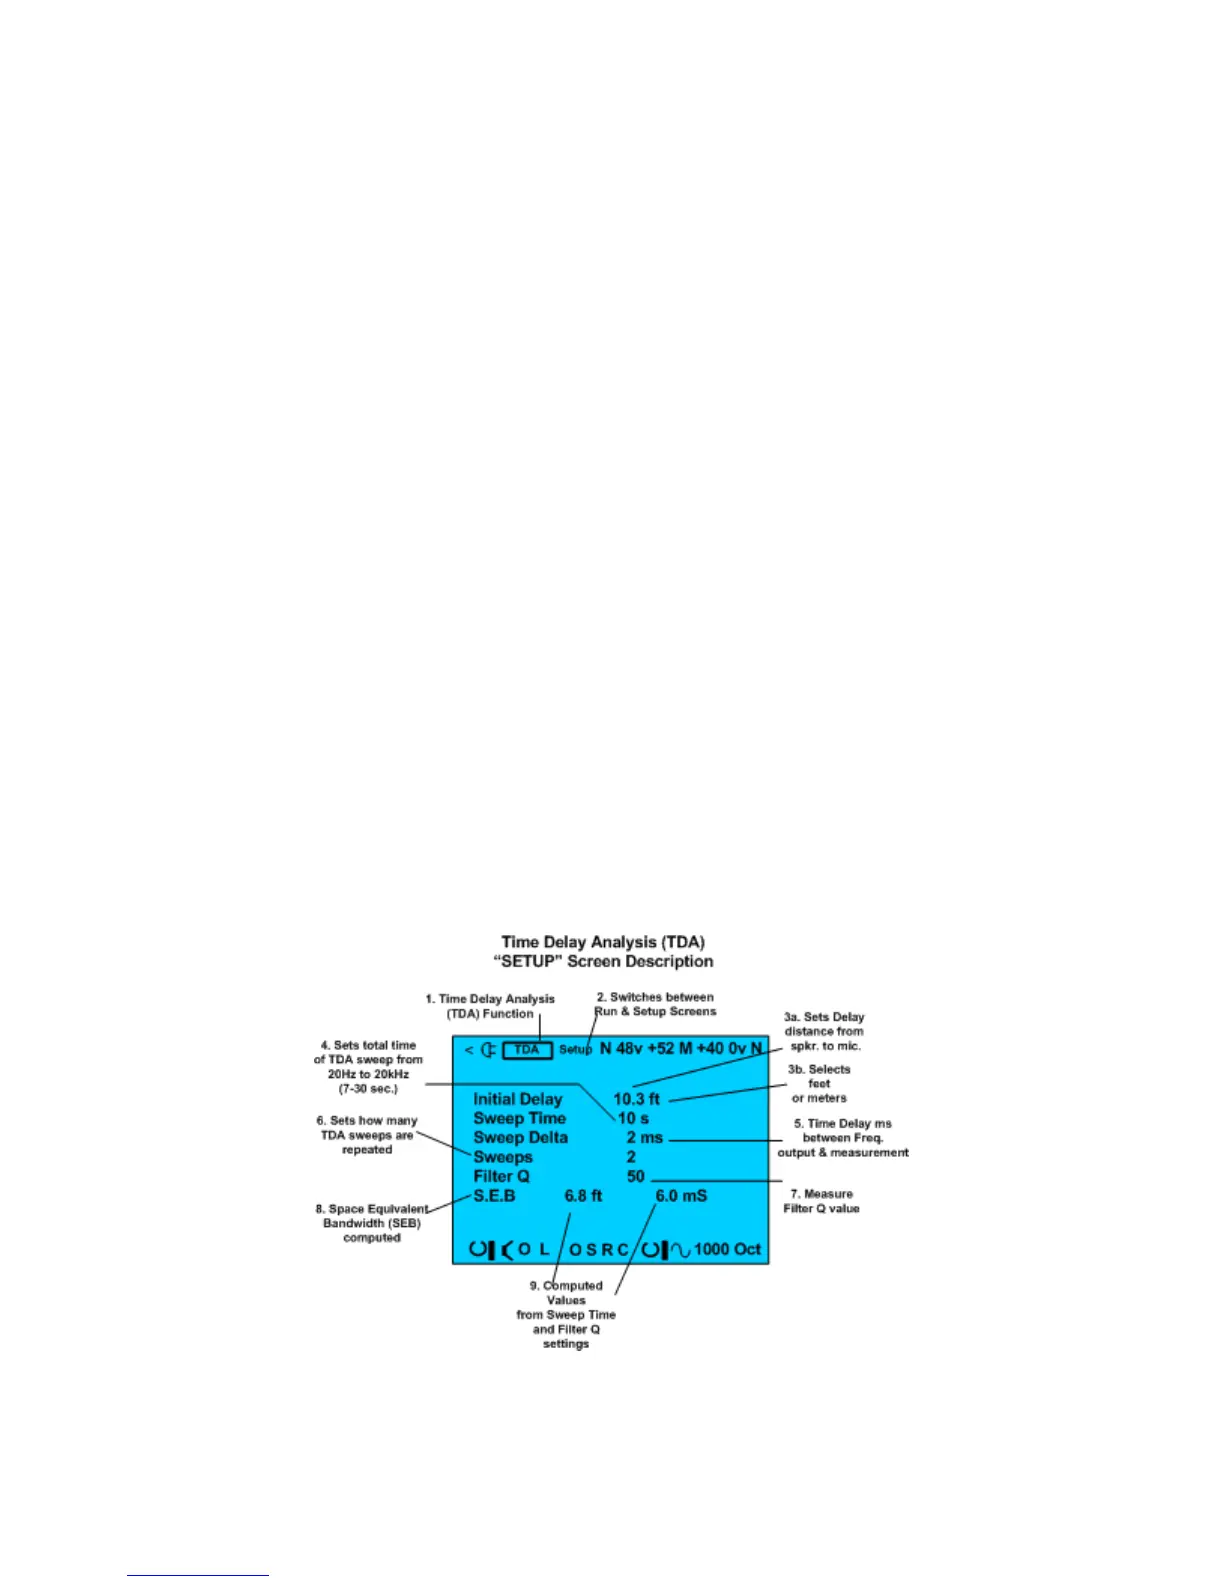
TDA Setup screen.
Time Delay Analyzer Setup Screen and Controls:
The TDA function includes a setup menu screen and a test menu screen. When you enter the
TDA function, the Setup screen is displayed first. This screen has the fields that you use to setup