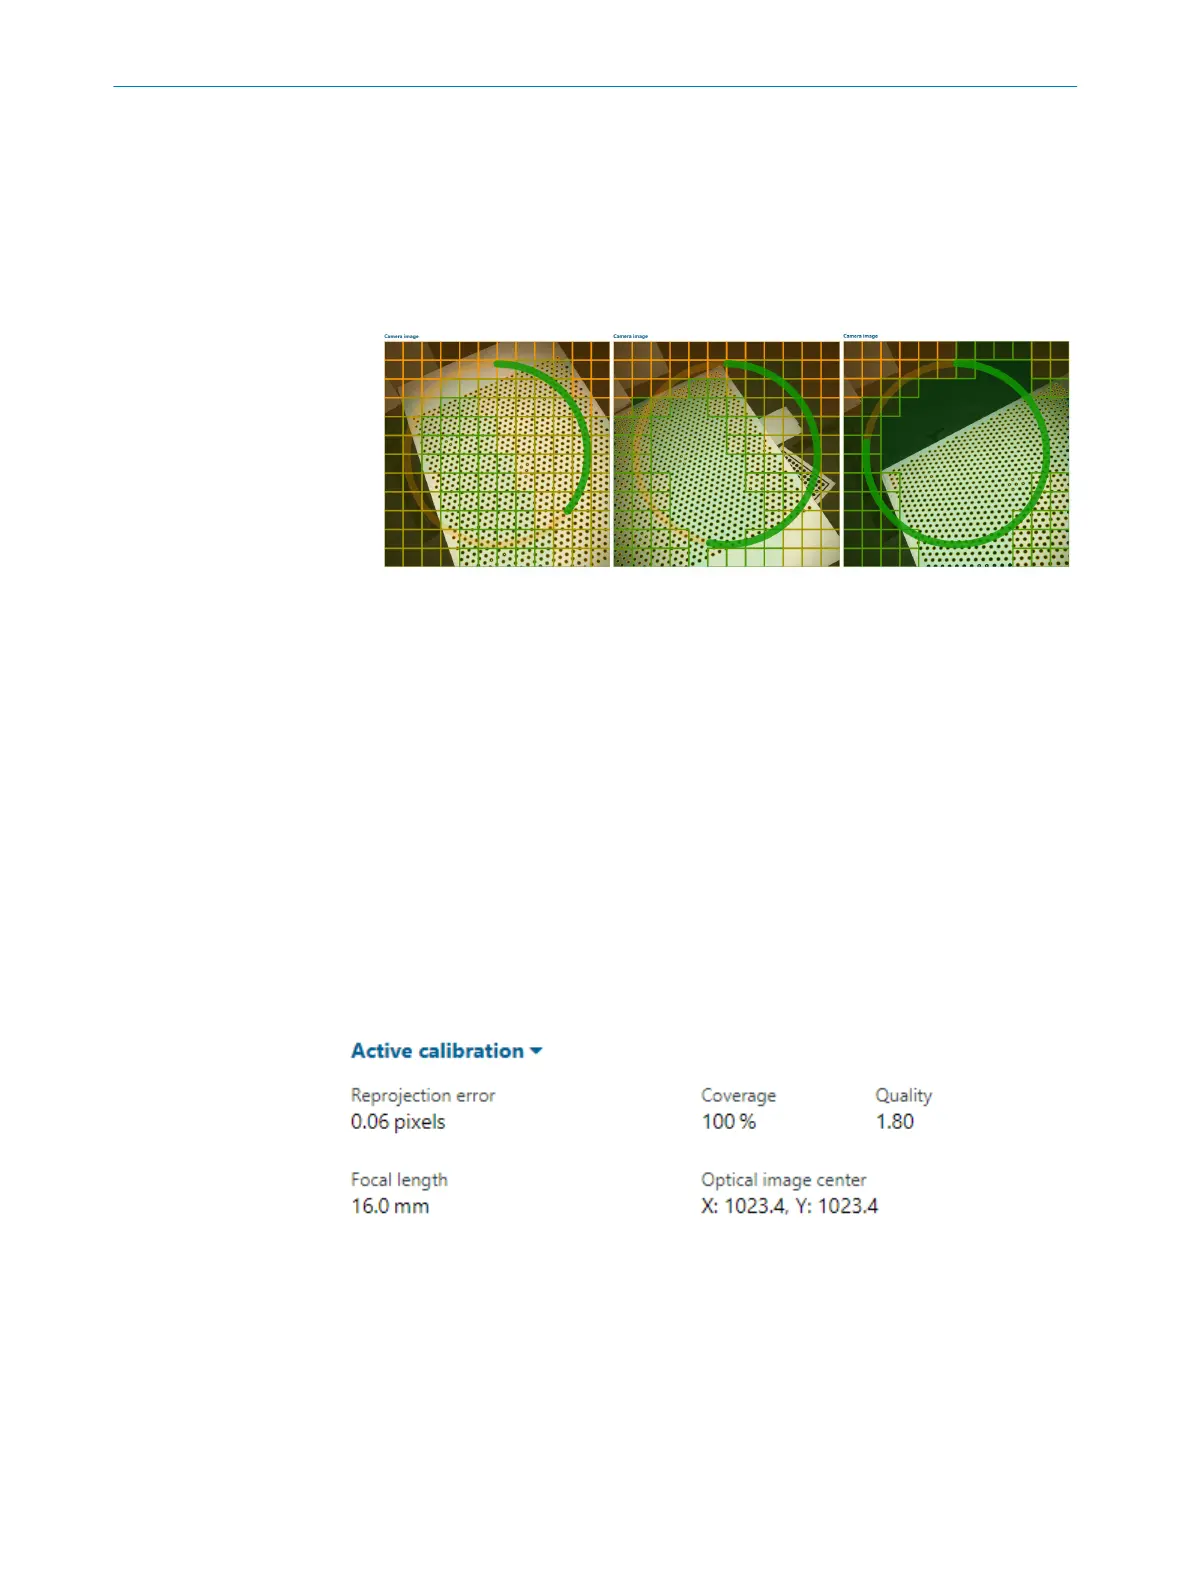
the progress (see figure 13, figure 14 and figure 15):
°
The fill level of the circle represents the overall coverage (%) of the field of
view.
°
The grid represents the coverage in the different regions of the field of view:
•
Each time a region is covered with calibration target data, the grid
gradually changes color from orange to green.
•
When a region has been covered with calibration target data three
times, the grid disappears.
Figure 13: 30% coverage
Figure 14: 50% coverage
Figure 15: 80% coverage
5. Collect as many images as necessary for good coverage of the field of view, up to
32 images.
An image will only be added to the calibration image set if the target can be accu‐
rately located, which is indicated in the image window by in-painted calibration
marks.
Click Previous and Next to browse the calibration images. Click Remove to remove an
image from the image set. Click Remove all to remove all images.
Start calibration
Once a good calibration image set has been collected, click Calibrate to start the
calibration. Note that the calibration may take up to a few minutes.
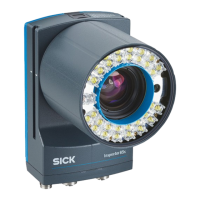
Calibration results
When the calibration is finished, the results are displayed in the Active calibration section
in the user interface (see figure 16).
Figure 16: Calibration results
The goal of the calibration is to achieve high coverage and a low reprojection error,
see table 1. Plausibility checks on estimated focal length and optical image center are
recommended.
OPERATION 7
8020736/1K3Z/2023-06 | SICK O P E R A T I N G I N S T R U C T I O N S | PLOC2D 4.1
41
Subject to change without notice