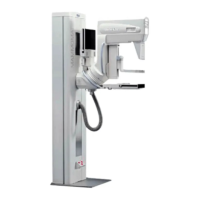
Siemens-Elema AB SPS-UD RX B7-120.033.01.10.02 MAMMOMAT 300
Solna, Sweden 05.98 65 02 186
12-4 Start-up and functional test of the IONTOMAT
Correction curve diagrams
The following diagrams approximately show the families of correction curves. The axes
"Quotient" and "Transparency correction" are the values shown in "Normal mode, Ion-
tomat data" with the service program.
0
5
10
15
20
25
30
70
71
72 73 74 75 76 77
78 79
85
quotient
thick object
thin object
transp. corr.
dark
light
25 kV Grid
A2
B2
C2
D2
Dia
ram 1
MAM00118
35
81
82 83
80
84
0
5
10
15
20
25
30
75
66
67 68 69 70 71 72
73 74
80
quotient
thick object
thin object
transp. corr.
dark
light
25 kV Magnification
A2
B2
C2
D2
Dia
ram 2
MAM00119
35
76
77 78
75
79
40
 Loading...