SC5 Signal Conversion Performance Measurements
66
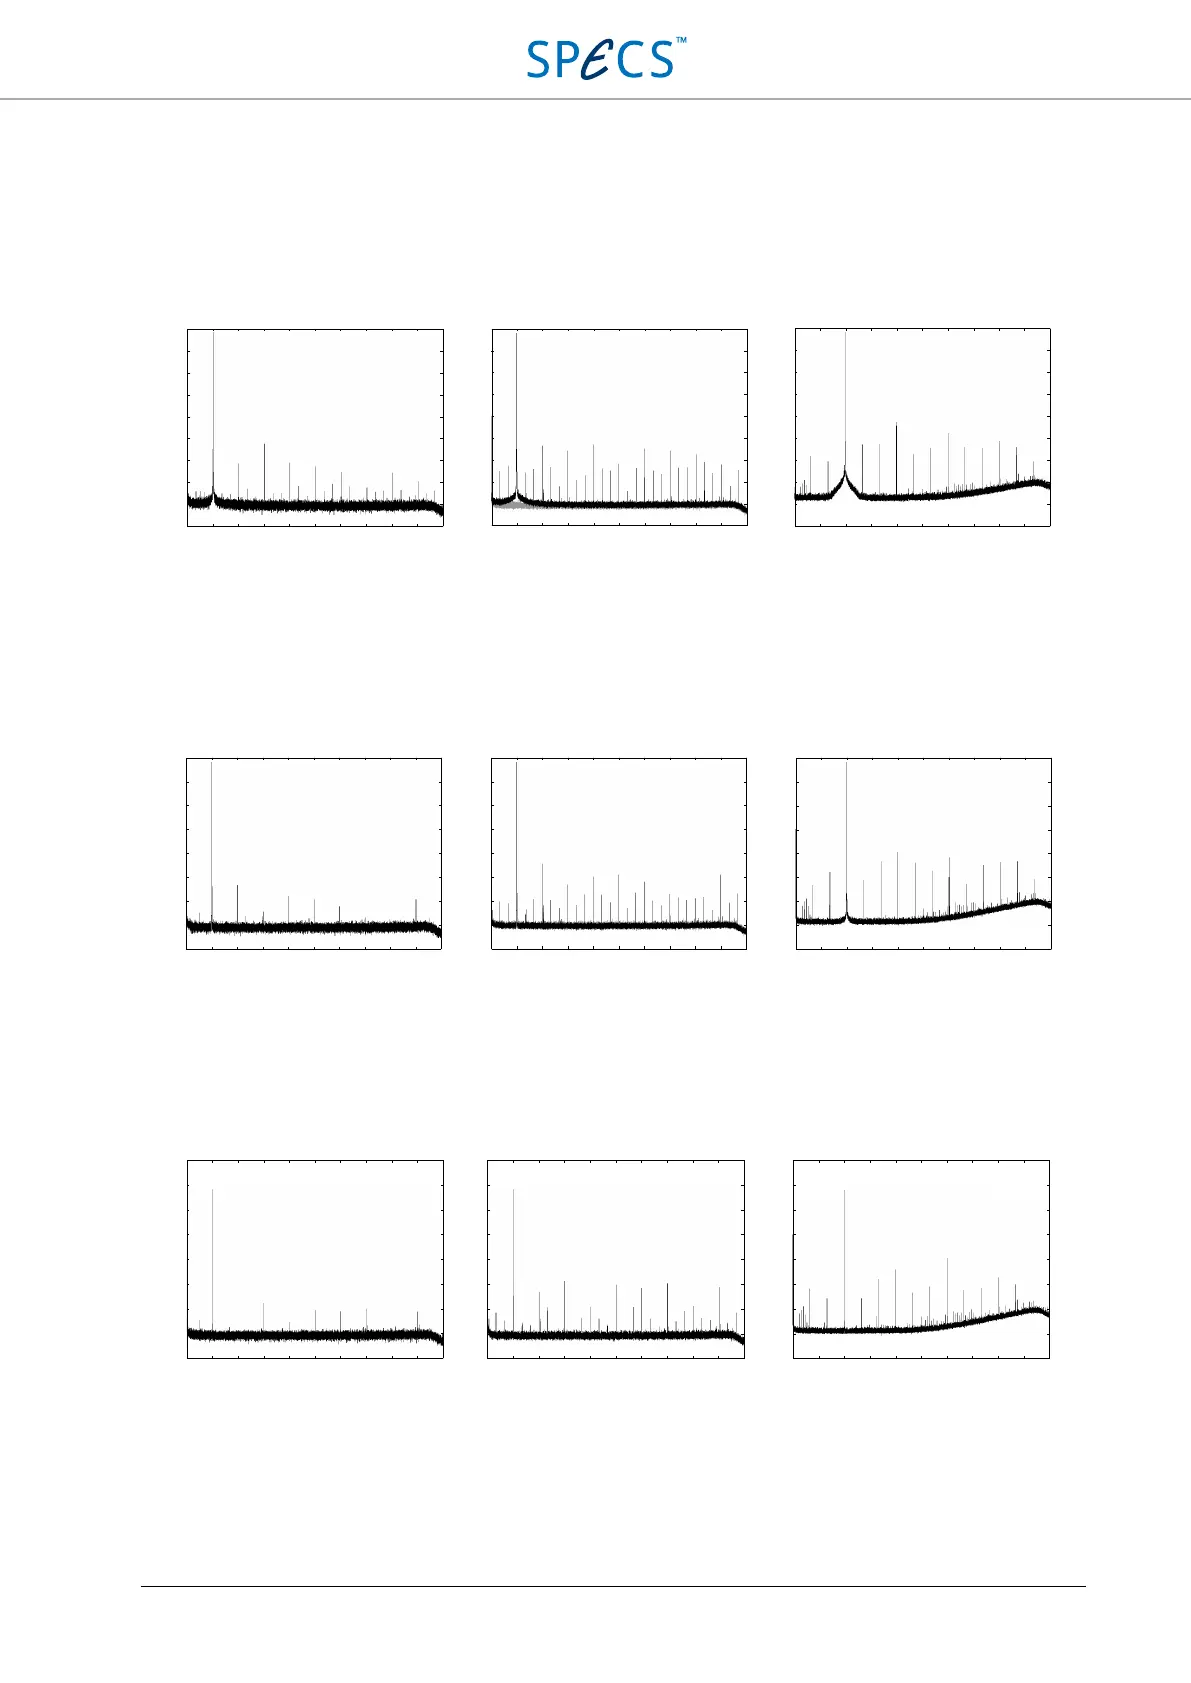
9 V amplitude
The following picture shows FFT spectra for 100 Hz (left), 1 kHz (center) and 10 kHz (right) signals at 9 V
amplitude. The input sensitivity of the acquisition module is 10 V. Its input noise (input shorted) is drawn in grey in
the 1 kHz measurement, with the curve being hidden by the SC5 measurement. Since the two noisefloors match, the
measurement noisefloor is given by the acquisition module noisefloor and not by the output noise of the SC5. Note
that the real noisefloor of the SC5 is more than 30 dB below the noisefloor of the below measurements.
Figure 47: Harmonic distortion measurements for a 9 V signal at 100 Hz (left), 1 kHz (center), and 10 kHz (right). The
grey curve is the noisefloor of the acquisition module.
900 mV amplitude
The following picture shows FFT spectra for 100 Hz (left), 1 kHz (center) and 10 kHz (right) signals at 900 mV
amplitude.
Figure 48: Harmonic distortion measurements for a 900 mV signal at 100 Hz (left), 1 kHz (center), and 10 kHz (right).
90 mV amplitude
The following picture shows FFT spectra for 100 Hz (left), 1 kHz (center) and 10 kHz (right) signals at 90 mV
amplitude.
Figure 49: Harmonic distortion measurements for a 90 mV signal at 100 Hz (left), 1 kHz (center), and 10 kHz (right).
0 100 200 300 400 500 600 700 800 900
Frequency [Hz]
Output [dBFS]
20
0
-20
-40
-60
-80
-100
-120
-140
-160
0 1 2 3 4 5 6 7 8 9 10
Frequency [kHz]
Output [dBFS]
20
0
-20
-40
-60
-80
-100
-120
-140
-160
0 5 10 15 20 25 30 35 40 45 50
Frequency [kHz]
Output [dBFS]
20
0
-20
-40
-60
-80
-100
-120
-140
-160
1000
SINAD: 79.7 dB
THD+N: -79.5 dB
THD: -80.3 dB
SFDR: 80.9 dBc
SINAD: 92.4 dB
THD+N: -93.4 dB
THD: -93.6 dB
SFDR: 102.3 dBc
SINAD: 93.1 dB
THD+N: -93.1 dB
THD: -99.1 dB
SFDR: 99.6 dBc
0
1
00
20
0
30
0 4
0
0 5
00
6
00
7
00 800 900
Fre
quen
cy [
Hz]
Output [dBFS]
0 1 2 3 4 5
6 7 8 9
10
Frequency [
kHz
]
Output [dBFS]
1000
0 10 20 30 40 50 60 70 80 90
10
0
Frequency [kHz]
Output [dBFS]
0
-20
-40
-
60
-80
-100
-120
-
140
-160
0
-20
-40
-60
-8
0
-100
-120
-140
-160
0
-
20
-40
-60
-
80
-100
-120
-140
-1
60
SINAD: 88.9 dB
THD
+N:
-88
.9 dB
THD
: -1
00.
7 dB
S
FDR:
101
.6 dBc
SI
NAD:
82.
1 dB
T
HD+N
: -8
2.1
dB
T
H
D:
-8
3
.8
dB
SFDR: 85.0 dBc
SINAD: 70.
3 dB
THD+N: -70.3 dB
THD: -72.7 dB
SFDR: 74.0 dBc
0 100 200 300 400 500 600 700 800 900
Frequency [Hz]
Output [dBFS]
0 1 2 3 4 5 6 7 8 9 10
Frequency [kHz]
Output [dBFS]
1000
0 5 10 15 20 25 30 35 40 45 50
Frequency [kHz]
Output [dBFS]
0
-20
-40
-60
-80
-100
-120
-140
-160
0
-20
-40
-60
-80
-100
-120
-140
-160
0
-20
-40
-60
-80
-100
-120
-140
-160
SINAD: 71.3 dB
THD+N: -71.2 dB
THD: -90.4 dB
SFDR: 92.2 dBc
SINAD: 66.0 dB
THD+N: -65.9 dB
THD: -70.3 dB
SFDR: 72.7 dBc
SINAD: 51.7 dB
THD+N: -51.7 dB
THD: -52.9 dB
SFDR: 54.3 dBc