26
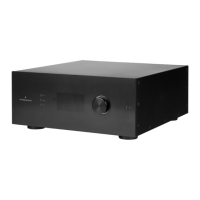
11. Measure Acoustic Response of
Sweet Spot
Place the microphone in the exact sweet spot
of the room at ear level to begin. It must be
in the le-to-right center of the room since
it will be used for loudspeaker distance and
level calculations. Select the arrangement you
wish to dene. Chair is for a single listening
position, Sofa Focused is for a wider listening
position still focused around the listener and
Sofa Wide Imaging for a wider area with more
microphones positions. Start the measurement
by pressing Proceed to Measure button. The
measurement waveform graphic is updated in
real time.
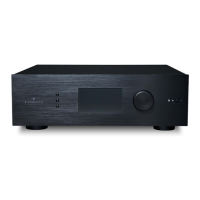
12. Measure Acoustic Response of
Remaining Positions
Once the rst measurement is taken, that
position will be checked indicating successful
capture. Move the microphone to the next
position of the diagram that you wish to
measure. Repeat measurements for all
listening positions. With each measurement,
the waveform graphic will update.
Click Proceed to lter design when done with
all 9 or 16 measurements.
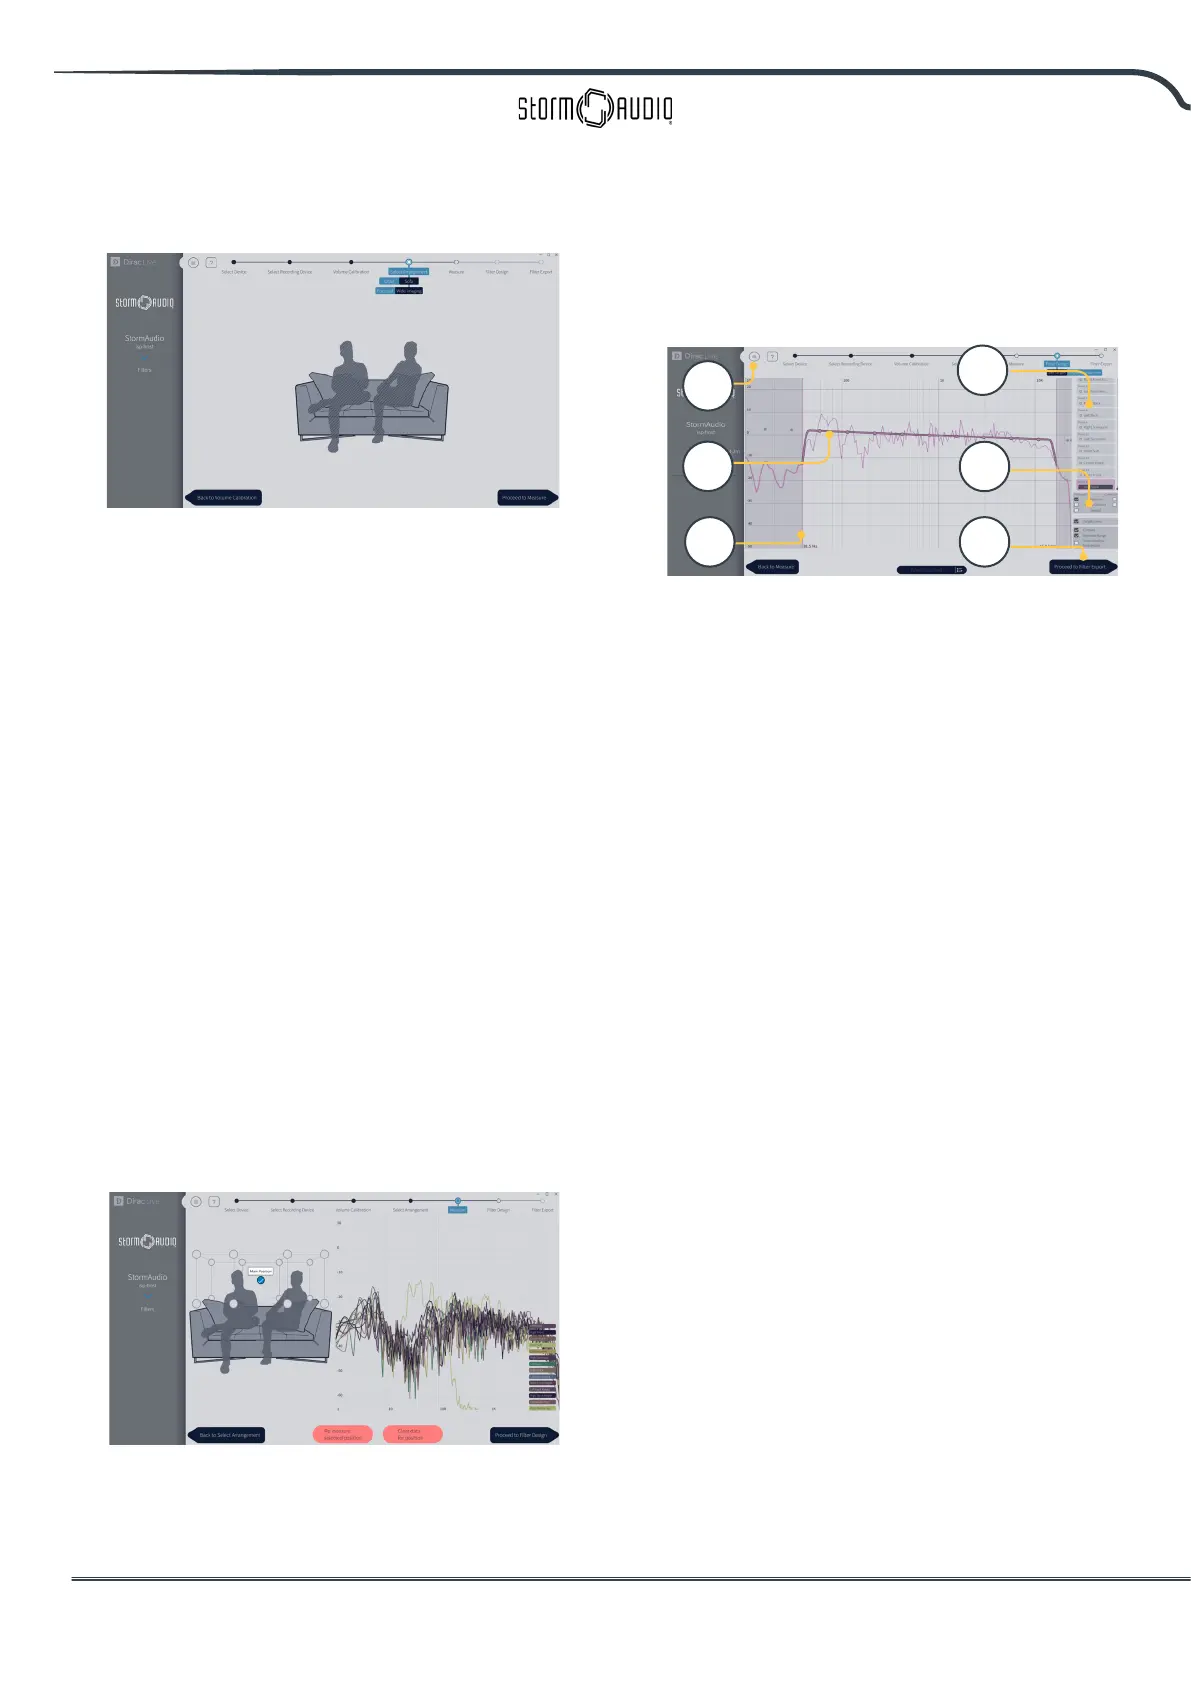
13. Target Curve
Once all measurements are complete, you can
visualize measurements of each speaker. You
can customize the target curve for each speaker
by (A) limiting the correction window and (B)
dragging anchor points on the target curve to
desired locations.By default a target curve is
proposed oering a typical cinema curve. It is
possible to save or load target curve through
menu (C). Good target curve design is beyond
the scope of this document, but there are some
key points to remember.
• Do not attempt to boost bass of a loudspeaker
below its low frequency limit as this will only lead to
high distortion and likely damage
• High quality speakers usually benet from limiting
the correction window to low frequencies.
• Ideal curves usually have a slightly downward slope.
A loudspeaker may have a at amplitude response
on axis, but will rarely be at o axis.
• Aim for identical target curves between channel
pairs (such as Front Le and Front Right) to obtain
the best spatial imaging. It is possible to create
group of speakers (D) before adjusting the target
curve for this group.
There are dierent possible viewing options
available (E). Save the Target Curve through
the Menu (C) for use in another channel or for
other future use. Repeat for all channels/group
of channels and then Proceed to Filter Export
(F).
14. Export Filters to ISP
In this last step, lters created in “Step 13.
Target Curve” on page 26 are exported to the
ISP and combined into the new prole selected
“Step 5. Select Base Prole” on page 24.
A
B
C
D
F
E