24
13. Viewing Melt reports and videos
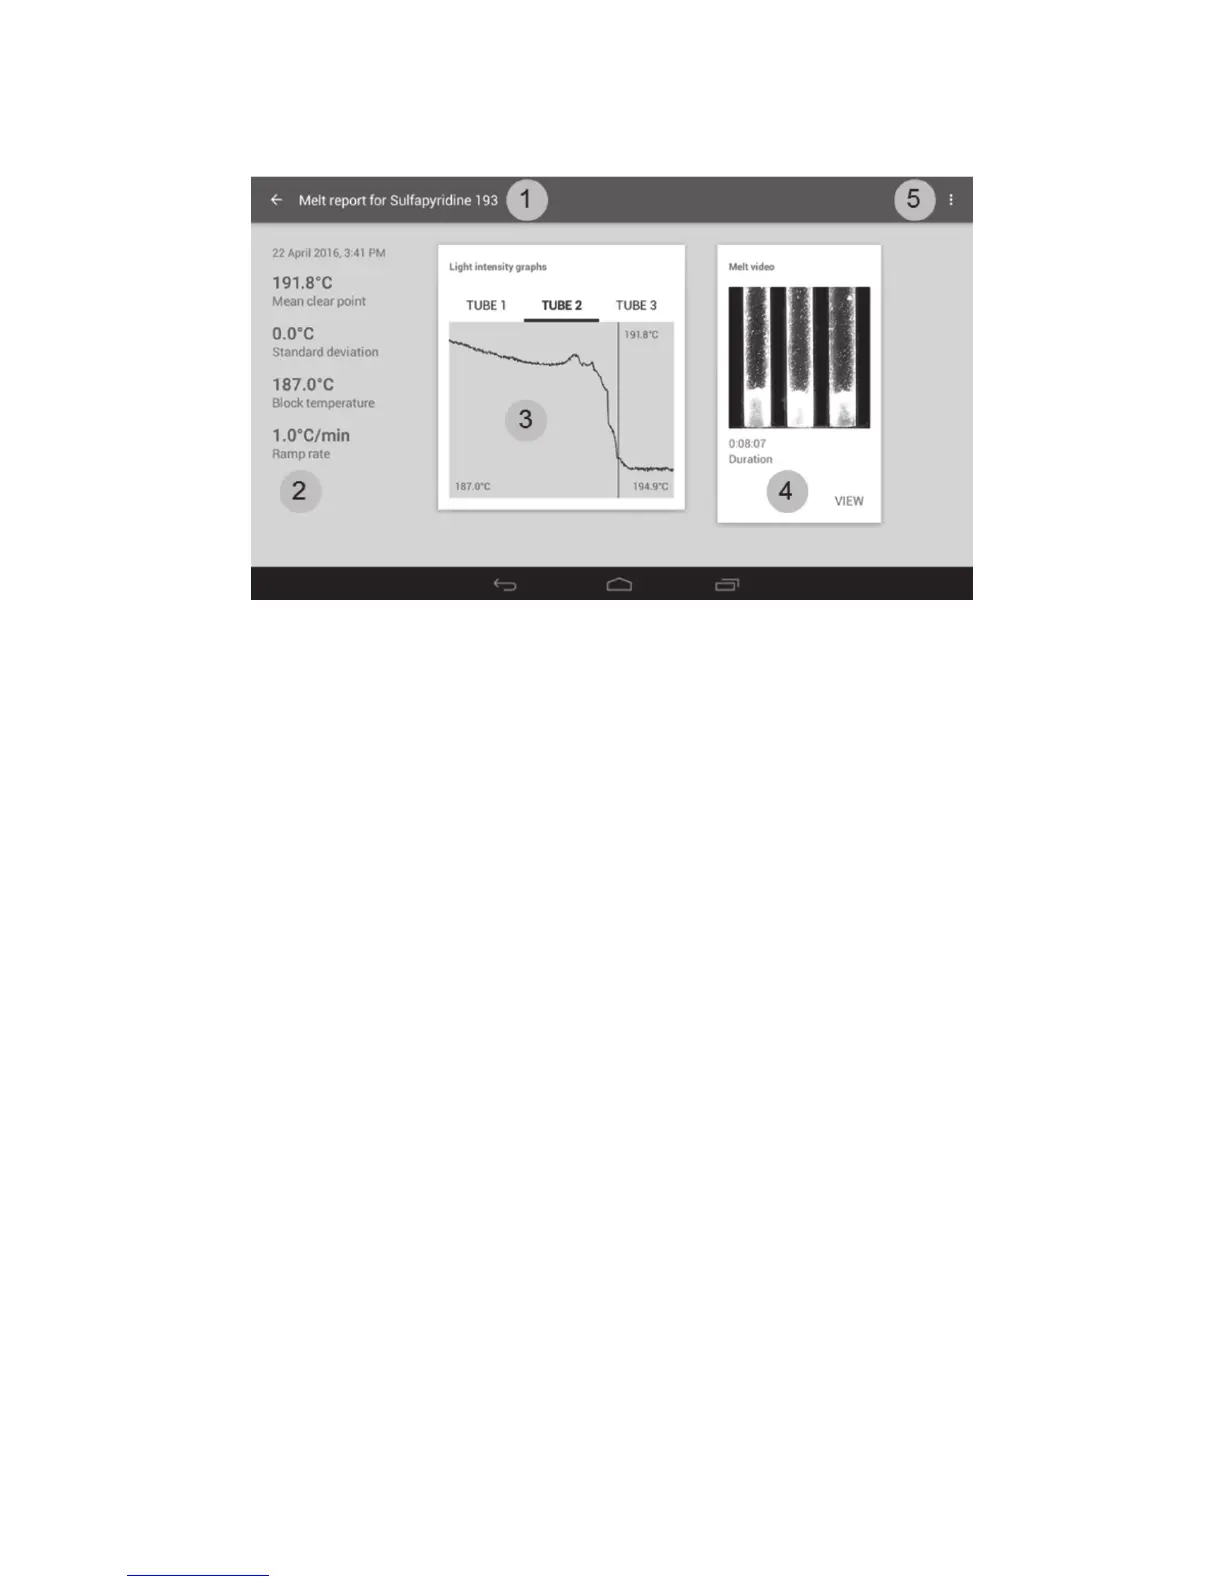
Once a melting point determination has completed the Melt report screen is displayed.
Melt report screen
1. File name of the Melt report. The back arrow returns to the previous screen.
2. Measurement and result summary with date and time stamp.
3. Light intensity graphs for each capillary tube.
4. Melt video (if saved).
5. Overflow icon. Allows copying, deletion and printing of the melt report.
The Melt report displays the mean clear point for the samples under test together with the details of
the measurement protocol and the light intensity graphs.
❖ Select ‘TUBE 1’, ‘TUBE 2’ or ‘TUBE 3’ to view the light intensity graphs for each capillary. Tube 1 is
the left hand tube, tube 2 is the centre tube and tube 3 is the right hand tube.
The light intensity graphs show the change in light intensity over the temperature change during the
run. The vertical bar represents the point at which the sample reached the clear point.
If you have chosen to save the melt videos, you can review the complete melting point determination.
❖ Touch ‘VIEW’ to view the saved video. The melt video screen will be displayed.