CheckPoint Pharma and CheckPoint
e
Operation and Maintenance Manual
SUEZ © 2018 71 of 112 DLM 97200-03 EN Rev. A
The TOC Chart and Customizing Data Display
Press until TOC Chart appears.
Customizing the Time Range
When viewing the data chart on the Main screen, you can customize the data display by pressing the
function keys as follows:
F1 - Display a chart with 20 minutes of data
F2 - Display a chart with 2 hours of data
F3 - Display a chart with 8 hours of data
F4 – display a chart with 24 hours of data
Customizing Data Resolution and the AutoScale Feature
Use the buttons to increase or decrease the concentration (in ppm or ppb) that is plotted on the
y-axis of the chart. If you continue to press the buttons, the Sensor cycles through the available
ranges until the AutoScale feature starts. The available ranges are as follows: 1, 2, 5, 10, 20, 50,
100, 200, and 500 ppb; and 1 and 2 ppm. The TOC trend is calculated from data collected in
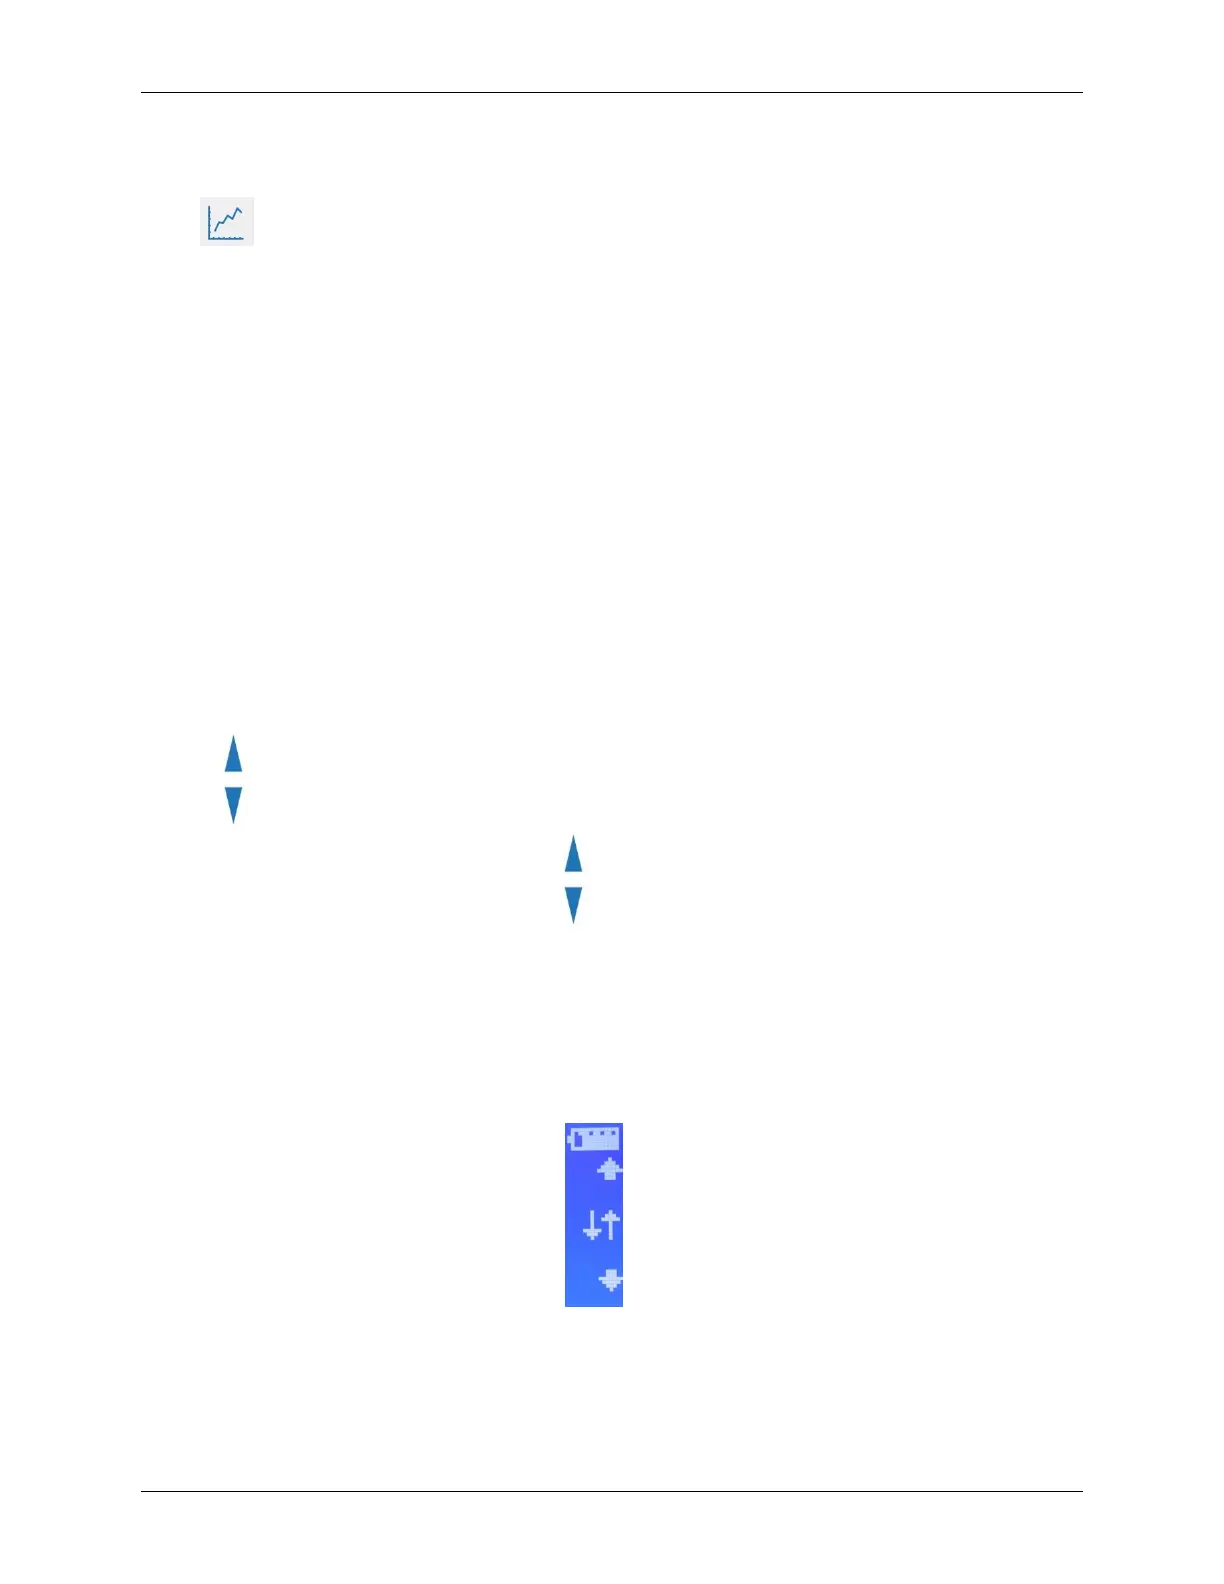
15-second intervals. With the AutoScale feature, The CheckPoint automatically sets the chart to
show the maximum concentration level for the current data set. When AutoScale is active, the
AutoScale Arrows display on the right side of the screen. When AutoScale is not active, the
AutoScale Arrows do not display.
Figure 26: AutoScale Arrows Indicate the AutoScale Feature is On