EasyManuals Logo

Sungrow SG33CX User Manual

Sungrow SG33CX
95 pages
To Next Page IconTo Next Page
To Previous Page IconTo Previous Page
Page #73 background imageLoading...
Page #73 background image
User Manual 7 iSolarCloud APP
63
fault info as shown in following figure.
Fig. 7-9 Detailed fault alarm info
7.7.2 Power Yields Records
User can view various energy records: power curve, daily energy histogram,
daily energy histogram, monthly energy histogram, and annual energy
histogram.
Tab. 7-5 Explanation of power yields records
Parameter
Description
Power curve
Show the power output from 5 am to 11 pm in a single
day. Each point in the curve is the percentage of
present power and nominal power.
Daily energy histogram
Shows the power output every day in the present
month.
Monthly energy
histogram
Shows the power output every month in a year.
Annual energy
histogram
Shows the power output every year.
Click the to view the power curve page as shown in following
figure.
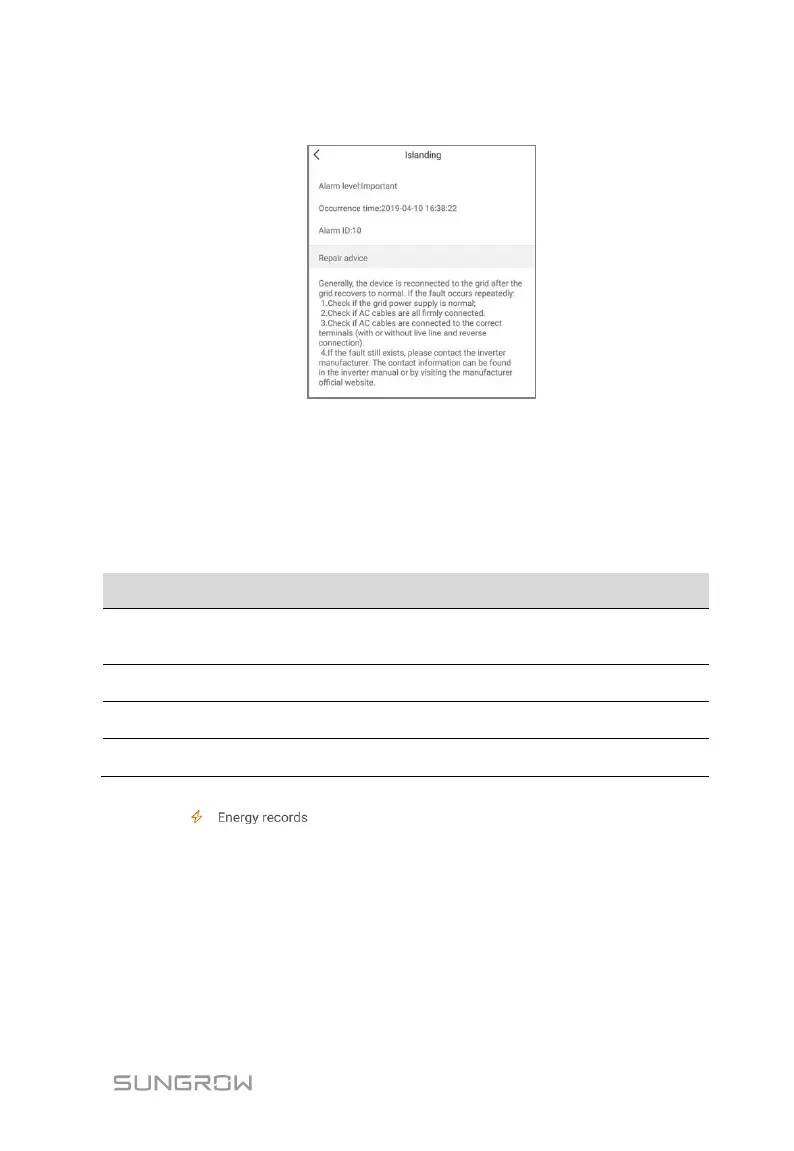
Table of Contents

Questions and Answers:

Question and Answer IconNeed help?

Do you have a question about the Sungrow SG33CX and is the answer not in the manual?

Sungrow SG33CX Specifications

General IconGeneral
ModelSG33CX
ManufacturerSungrow
Rated Power33 kW
Max DC Voltage1100 V
Max Efficiency98.7%
Start Voltage200 V
Total Harmonic Distortion< 3%
Power Factor at Rated Power1
DC Connection TypeMC4
Allowable Relative Humidity Range0 - 100%
Operating Altitude4000 m
MPPT Voltage Range200 V - 1000 V
AC Voltage Range310 V - 480 V
Rated Grid Frequency50 Hz / 60 Hz
Adjustable Power Factor Range0.8 leading to 0.8 lagging
Operating Ambient Temperature Range-25 °C ... +60 °C
CommunicationRS485

Related product manuals