Sutron Corporation Satlink Operations & Maintenance Manual, Rev 8.04.2 11/3/2016 pg. 50
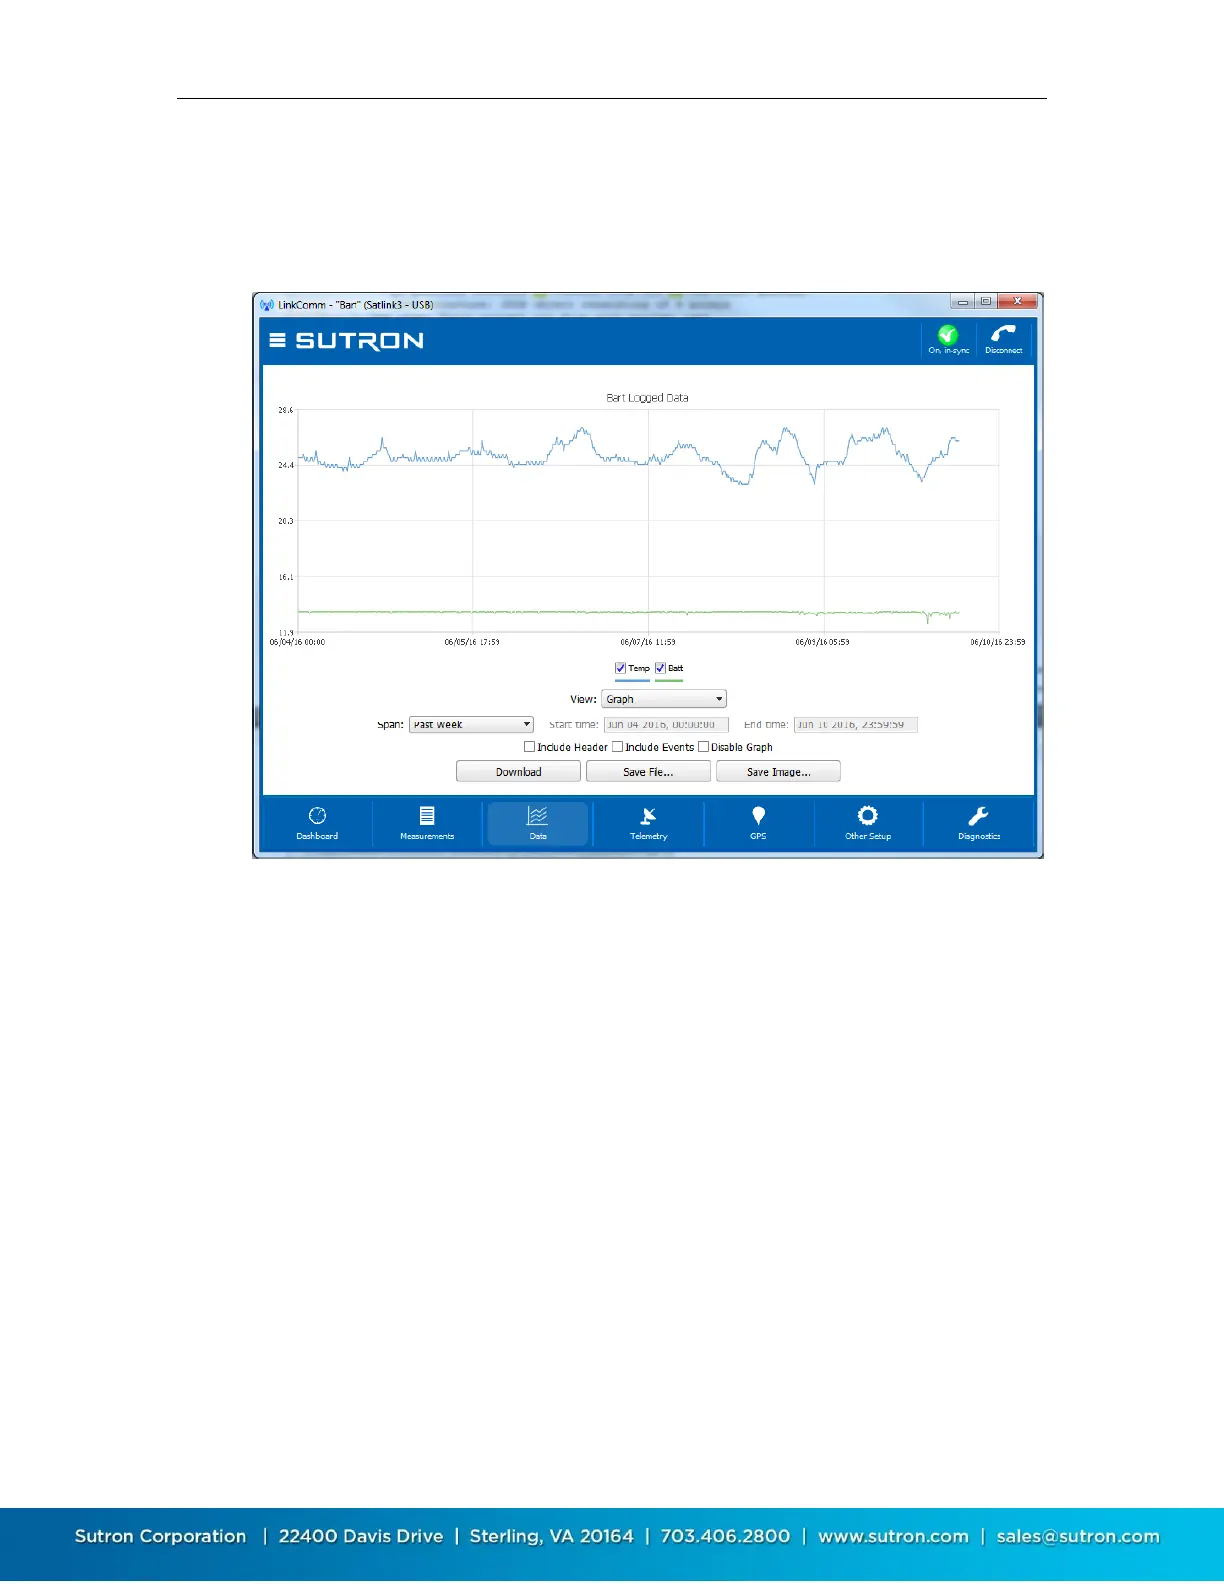
5.8. Data Tab
The data tab shows historical measurement readings made by Satlink. If recent data was
downloaded when connecting to Satlink, the graph displays this data the first time you select the
Data tab.
To zoom-in on subsets of data, click-and-drag to create a rectangle around the data you want to
zoom to. To restore the zoom to all data, double-click. When using a touchscreen, you may use
your finger to draw the rectangle, and double-tap to reset the zoom.
Right-clicking (or touching) the graph will show a menu allowing you to select all series, deselect
all series, or show points. You may select or deselect individual data series for display using the
legend just below the graph.
Change the span of the period to graph using the Span control. Several options are available.
Whenever a change to span is made, you must press the Download button to retrieve the data
for display. When the defined span no longer matches the displayed span, the download button
text changes to “Download***”.
Press Save File… to save the raw data to a text file. Press Save Image… to save an image of the
graph to disk. On mobile platforms, rather than save files to disk, you are prompted to “share”
the files via other services like Email, Dropbox (if installed), etc.
Change View to Table to see a table view of the data, rather than a graph.
Enabling Disable Graph causes the graph (or table) view to remain empty while data is being
downloaded. This can improve performance for very large downloads.