Sutron Corporation Satlink Operations & Maintenance Manual, Rev 8.04.2 11/3/2016 pg. 83
Max Direction
Count
Time of Max Speed
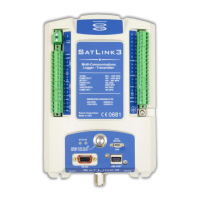
After picking the result, set the schedule for the calculation. The following schedule computes a
15 minute average of wind data collected every 60 seconds. The sampling interval (e.g. 60
below) must match with the interval set for the speed and direction sensors setup separately.
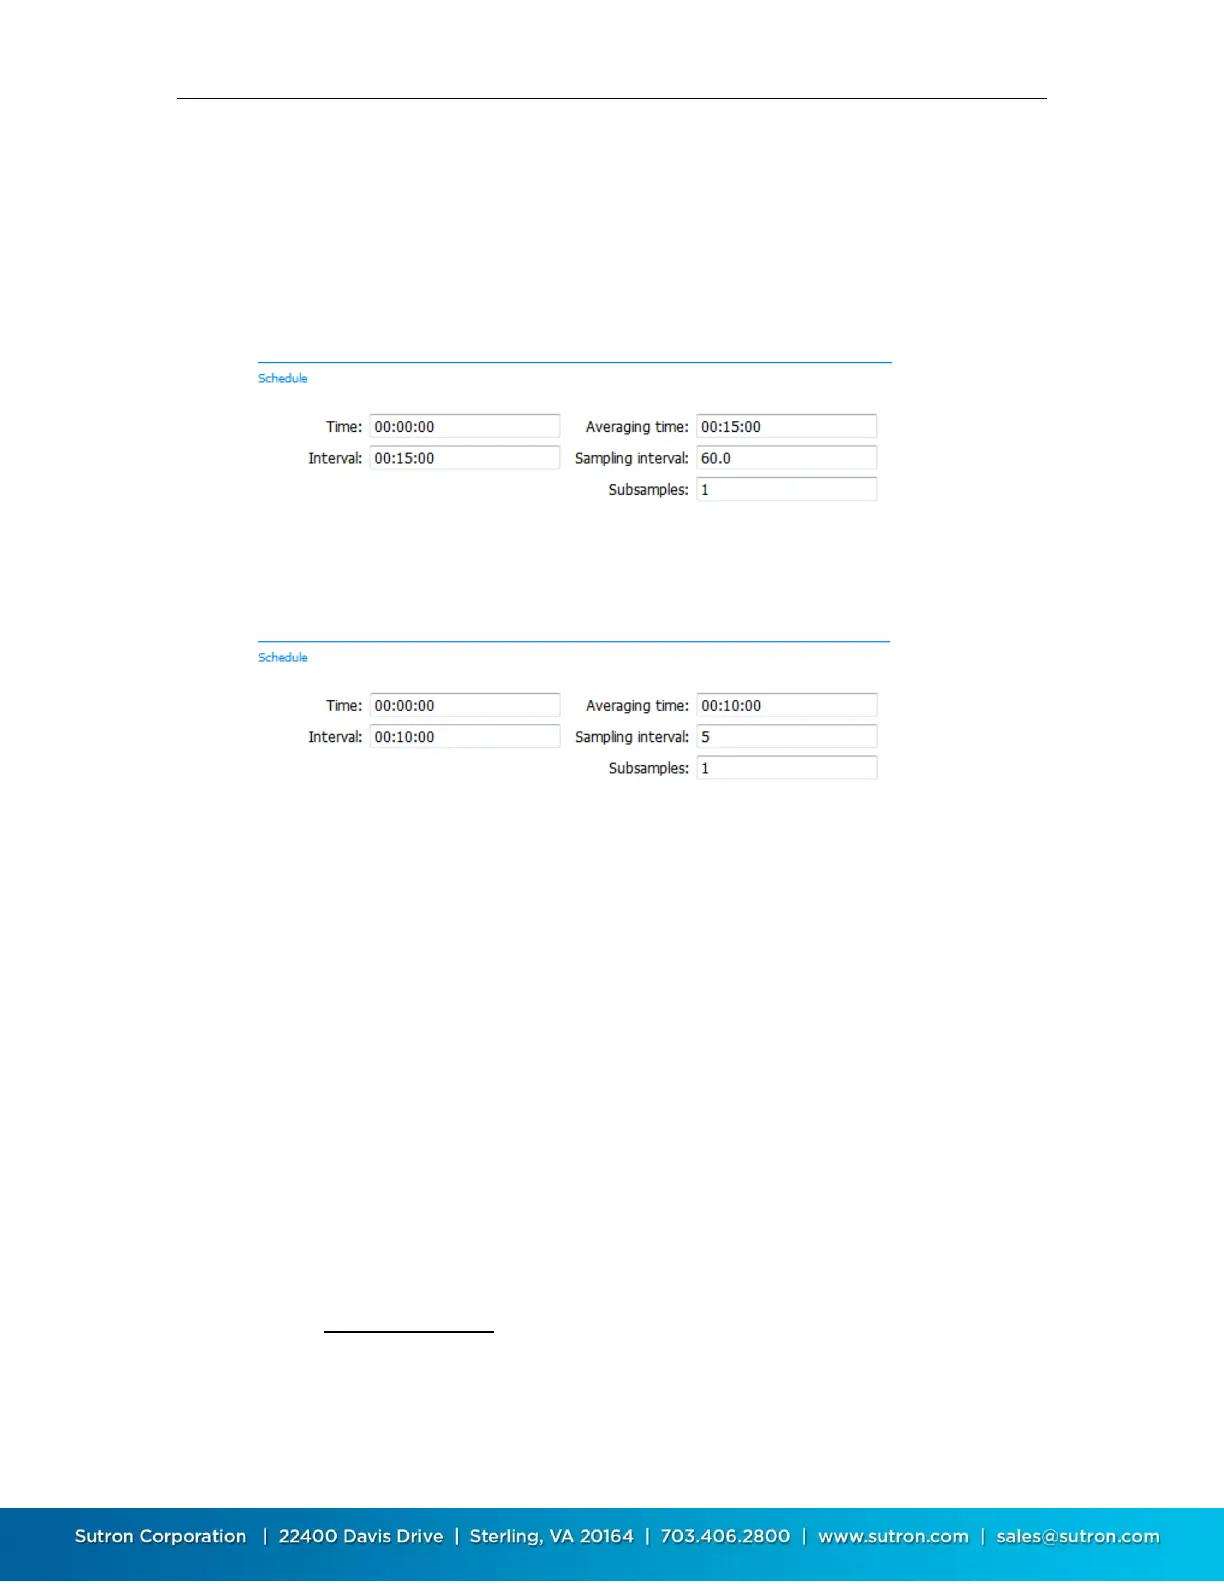
Here’s the setup for wind processing to compute a 10 minute average with data collected every 5
seconds. Again, the sampling interval 5 much match the measurement interval setup for the
speed and direction sensors.
When you setup multiple results, make sure each has the same schedule.
The following sections give details on each of the results.
9.3.6.2. Wind Results
The Wind Measurement type processes data using Vector Average techniques
that are needed to any sensor that has a circular discontinuity, such as a wind
direction sensor with the crossover from 0 to 359 degrees. In these cases,
simple averaging does not work -- the mean of 0 and 359 is 179.5, which is
clearly incorrect. Calculating a vector average provides a way around this
problem.
When the data is processed the software automatically performs several
different types of vector calculations, each conveying slightly different
information. It is up to the user to pick which results meet the requirements for
the measurement. While the wind processing is geared toward wind sensors, it
could be used any time performing a vector average is desired.
The results of Wind processing are as follows, with vector math shown below.
Mean Speed Scalar – This is the scalar wind speed, not taking direction into
account. The scalar average of 10mph for an hour and 20mph for an hour is
15mph, regardless of changing direction. This result is identical to the value
you’d get with a simple average of the speed.