Density Graph
The function Density Graph enables the exact display of density values for any spot
color. Usually the standards dene density lter characteristics only for the process
colors Cyan, Magenta, Yellow and Black. Thanks to the spectral measurement of
SpectroDens, a virtual spectral density characteristic for any spot color can be ob-
tained. The great advantage is that the process control of spot colors can now be
as easily achieved as known from the four process colors.
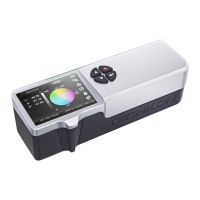
In the following example a measurement
has been made on a blue spot color.
The density graph is derived from the re-
mission spectrum and represents the den-
sity spectrum for wavelengths from 400 to
700 nm. The peak of the curve displays where
the spectral density value has to be taken.
In this case the spectral density for the blue
color is D = 1.57 at a peak wavelength of
580 nm.
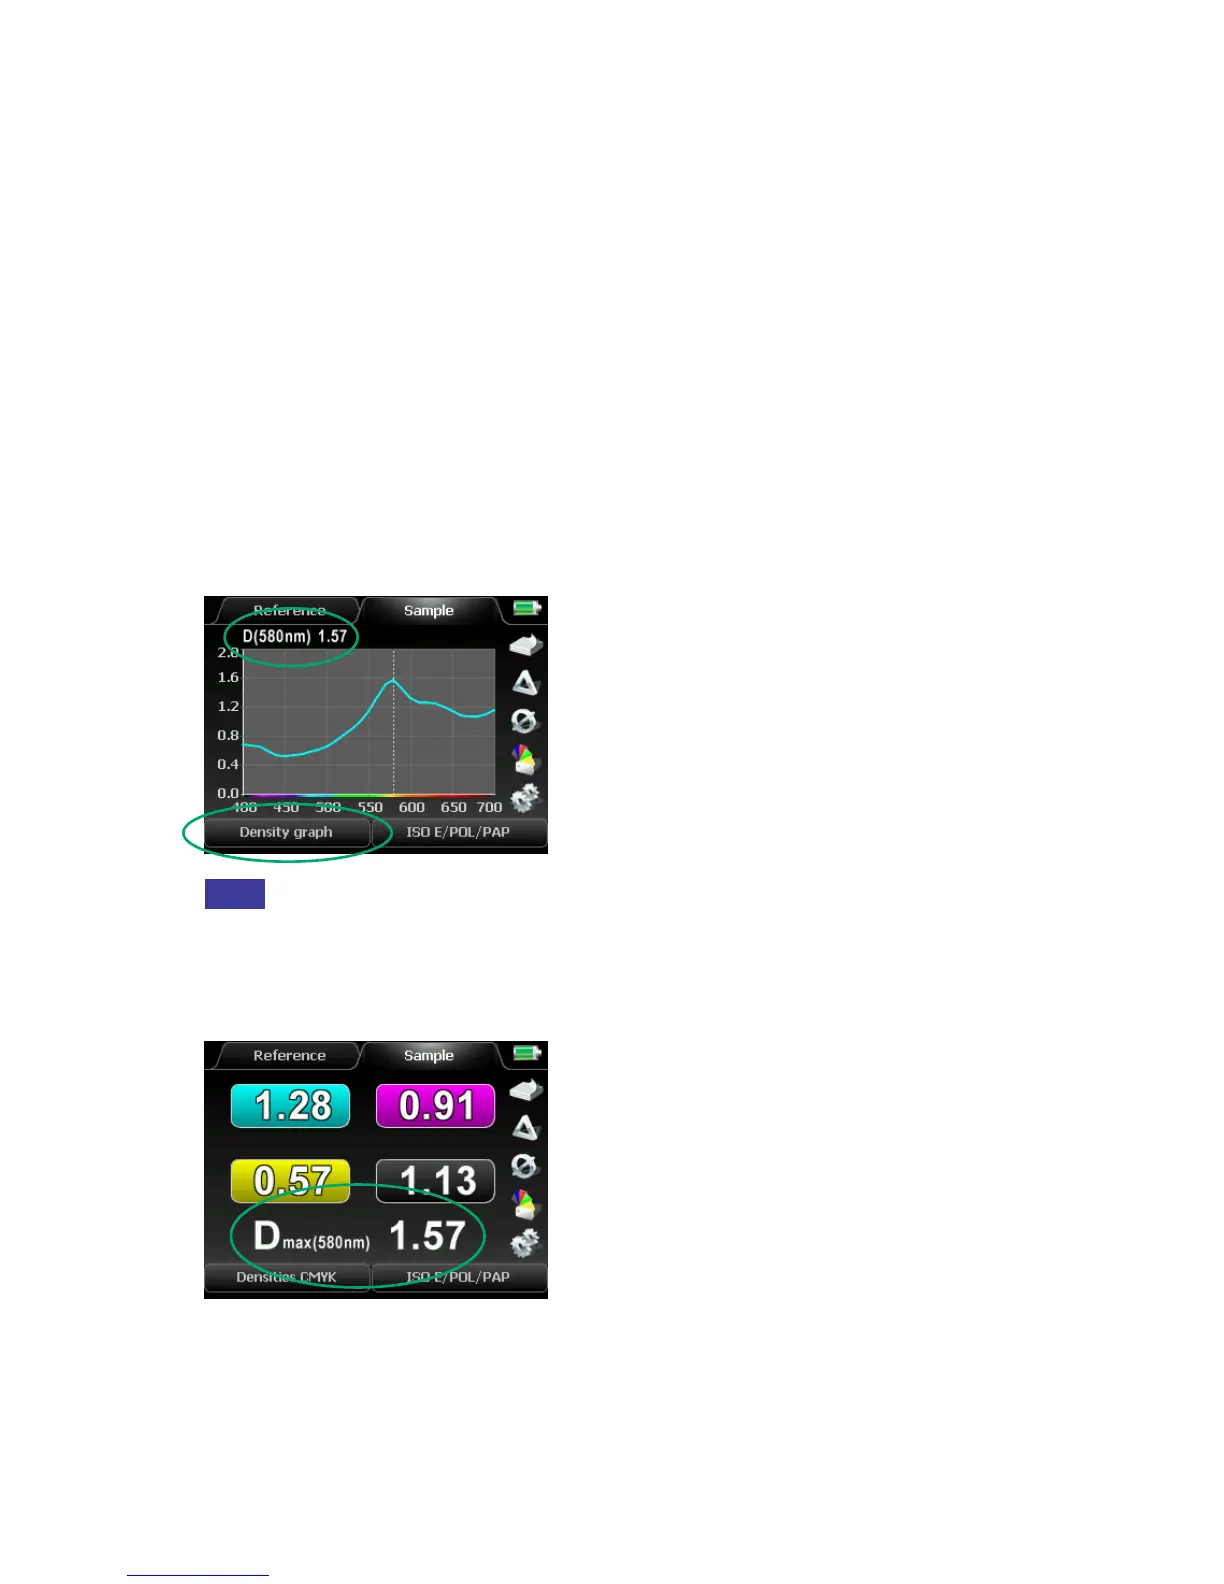
Only spectral densities relating to the same
peak wavelength (Dmax) can be compared.
SpectroDens displays the spectral density
automatically as well in the Densities CMYK
measurement mode.
The density values for CMYK show to what ex-
tent the spot color can as well be registered
by the CMYK-color related standard density
lters.
Here in this case, the blue color is close to a
Cyan, therefore the density value in the Cyan
channel is quite high.