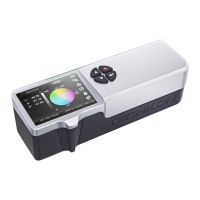
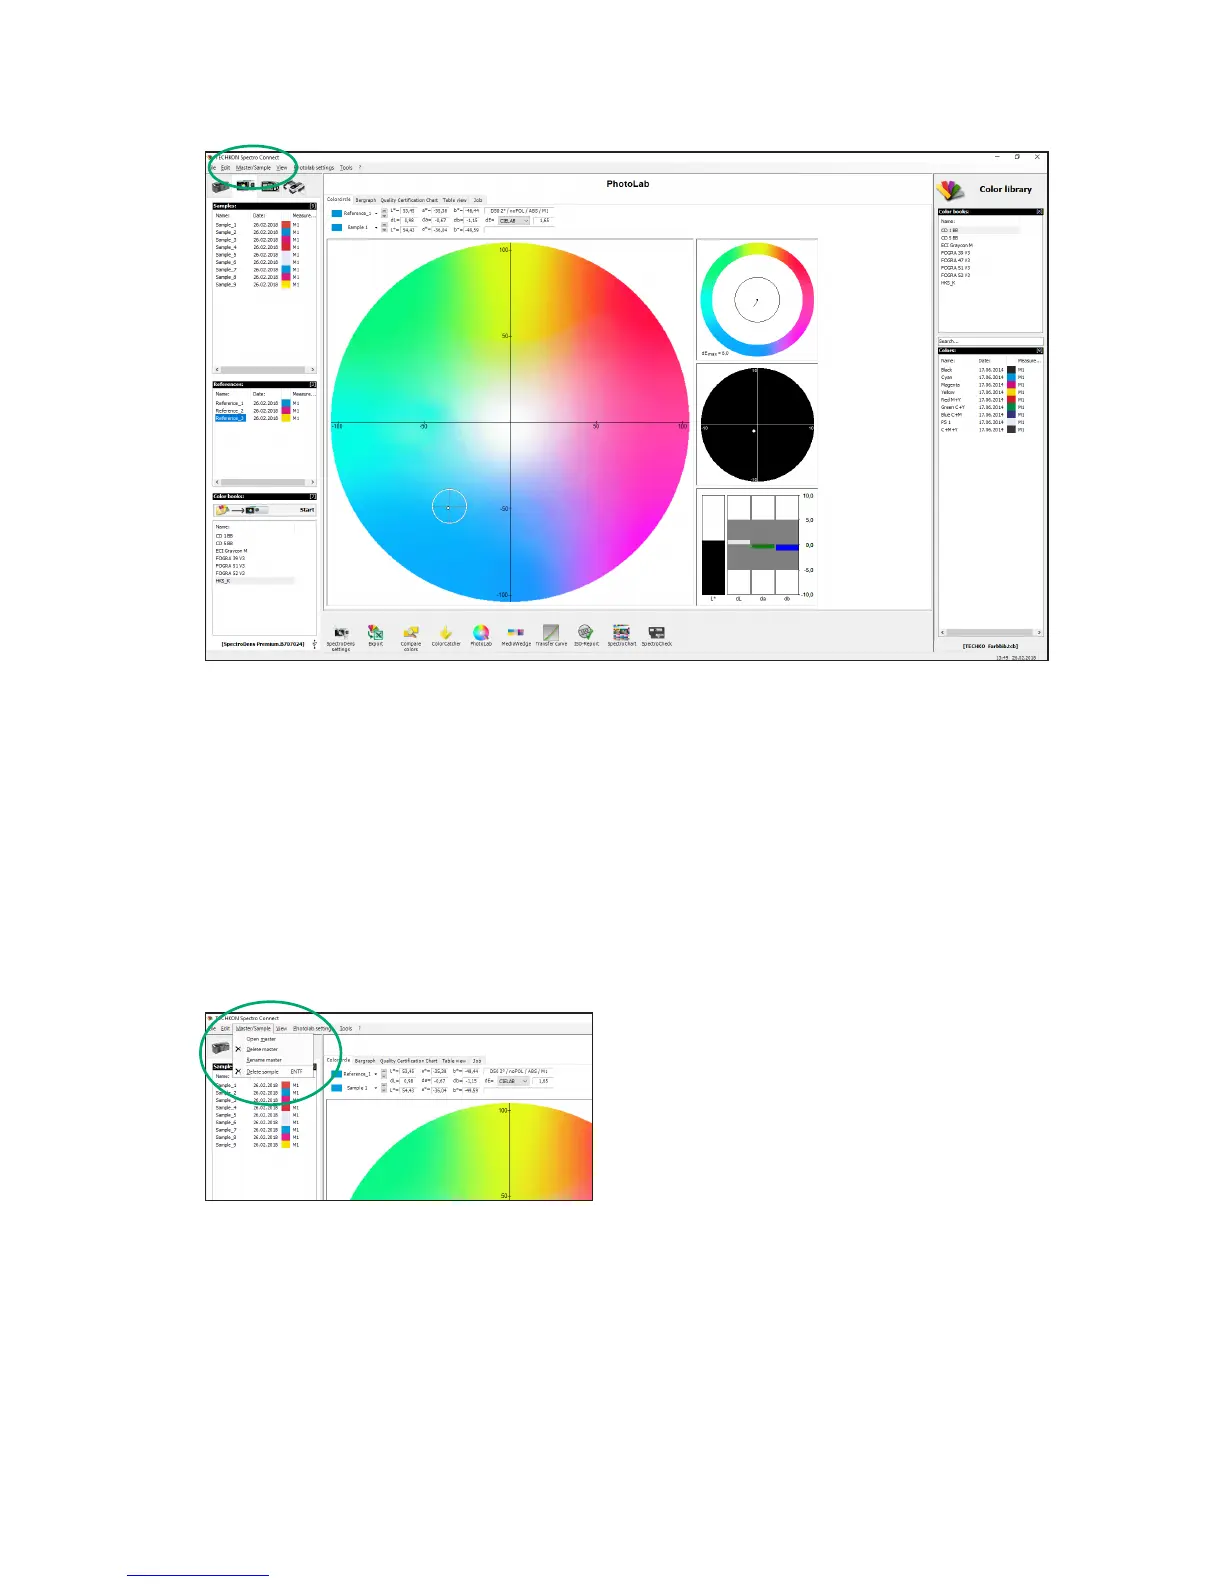
1. Samples and references can be selected di-
rectly with a mouse click or by choosing from
the “pull-down” menu.
Delete and renaming is done via the menu.
2. Dierent modes of the L*a*b*-display can
be selected:
The modes Bargraph and Quality Certi-
cation Chart show the trend of ∆L*-, ∆a*- and
∆b*-values of a measurement series.
The Table View shows all values numeri-
cally.
In the Job window job relevant text data
can be edited.
3. A measurement value highlighted in red
indicates an out-of-tolerance sample.
4. The black circle line indicates the tolerance
limit of the ∆E*-region. If the black pointer
reaches into the outer segment of the circle,
the tolerance has been exceeded.
5. Enlarged view of the tolerance circle
6. Display of the color components ∆L*, ∆a*
and ∆b*.
1.
2.
3.
4.
5.
6.