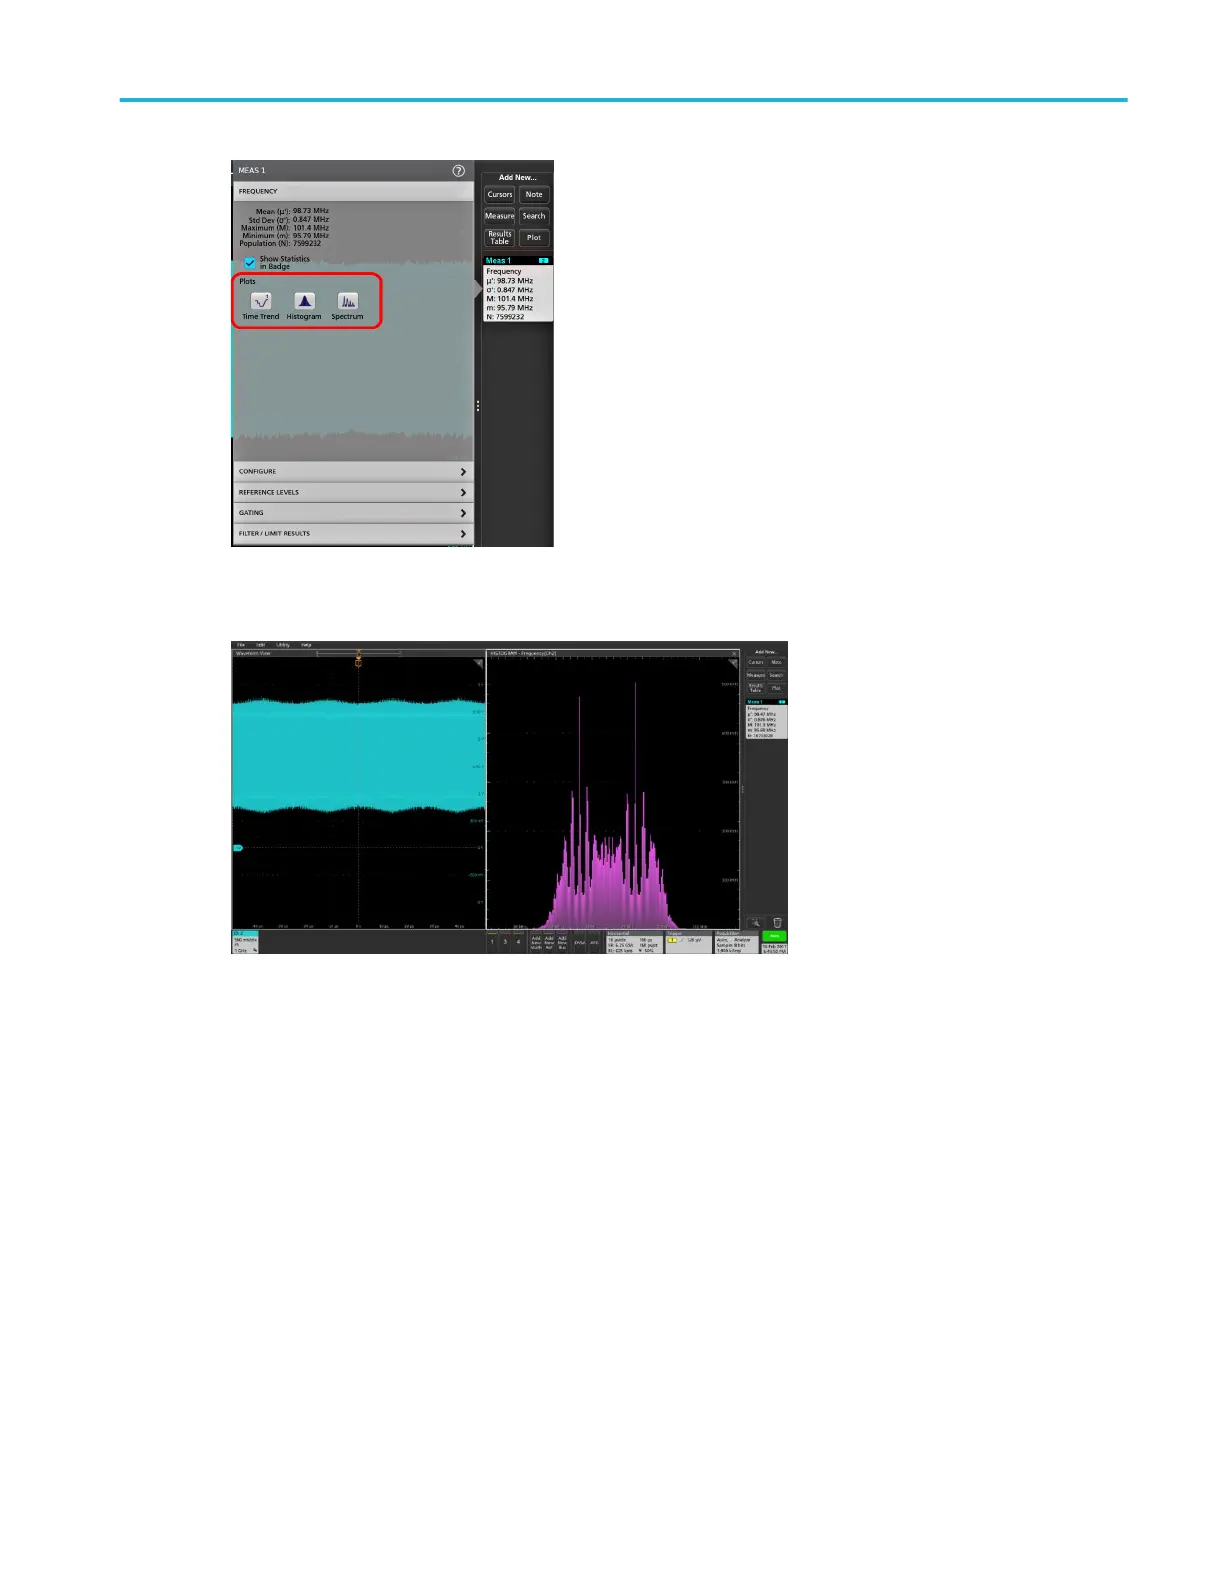
The following shows adding a Histogram plot.
You can add more than one plot to measurements (to different measurements or the same measurement). For example,
you can add two histogram plots for the same measurement, set one to display the X-Axis with a Logarithmic scale, and the
other plot to display the X-Axis with a Linear scale.
3. You can move plot windows by dragging the Plot view title bar to a new position. The blue background area moves to show
where the plot will be located when you remove your finger from the title bar. You can also resize plot windows by selecting
and dragging the Plot view border. You should use a mouse to do these operations, as it is easier to select and drag plots
with a mouse.
Analog channel operating basics
MSO54, MSO56, MSO58, MSO58LP, MSO64 Help 99
 Loading...


