www.ti.com
RP+L Page
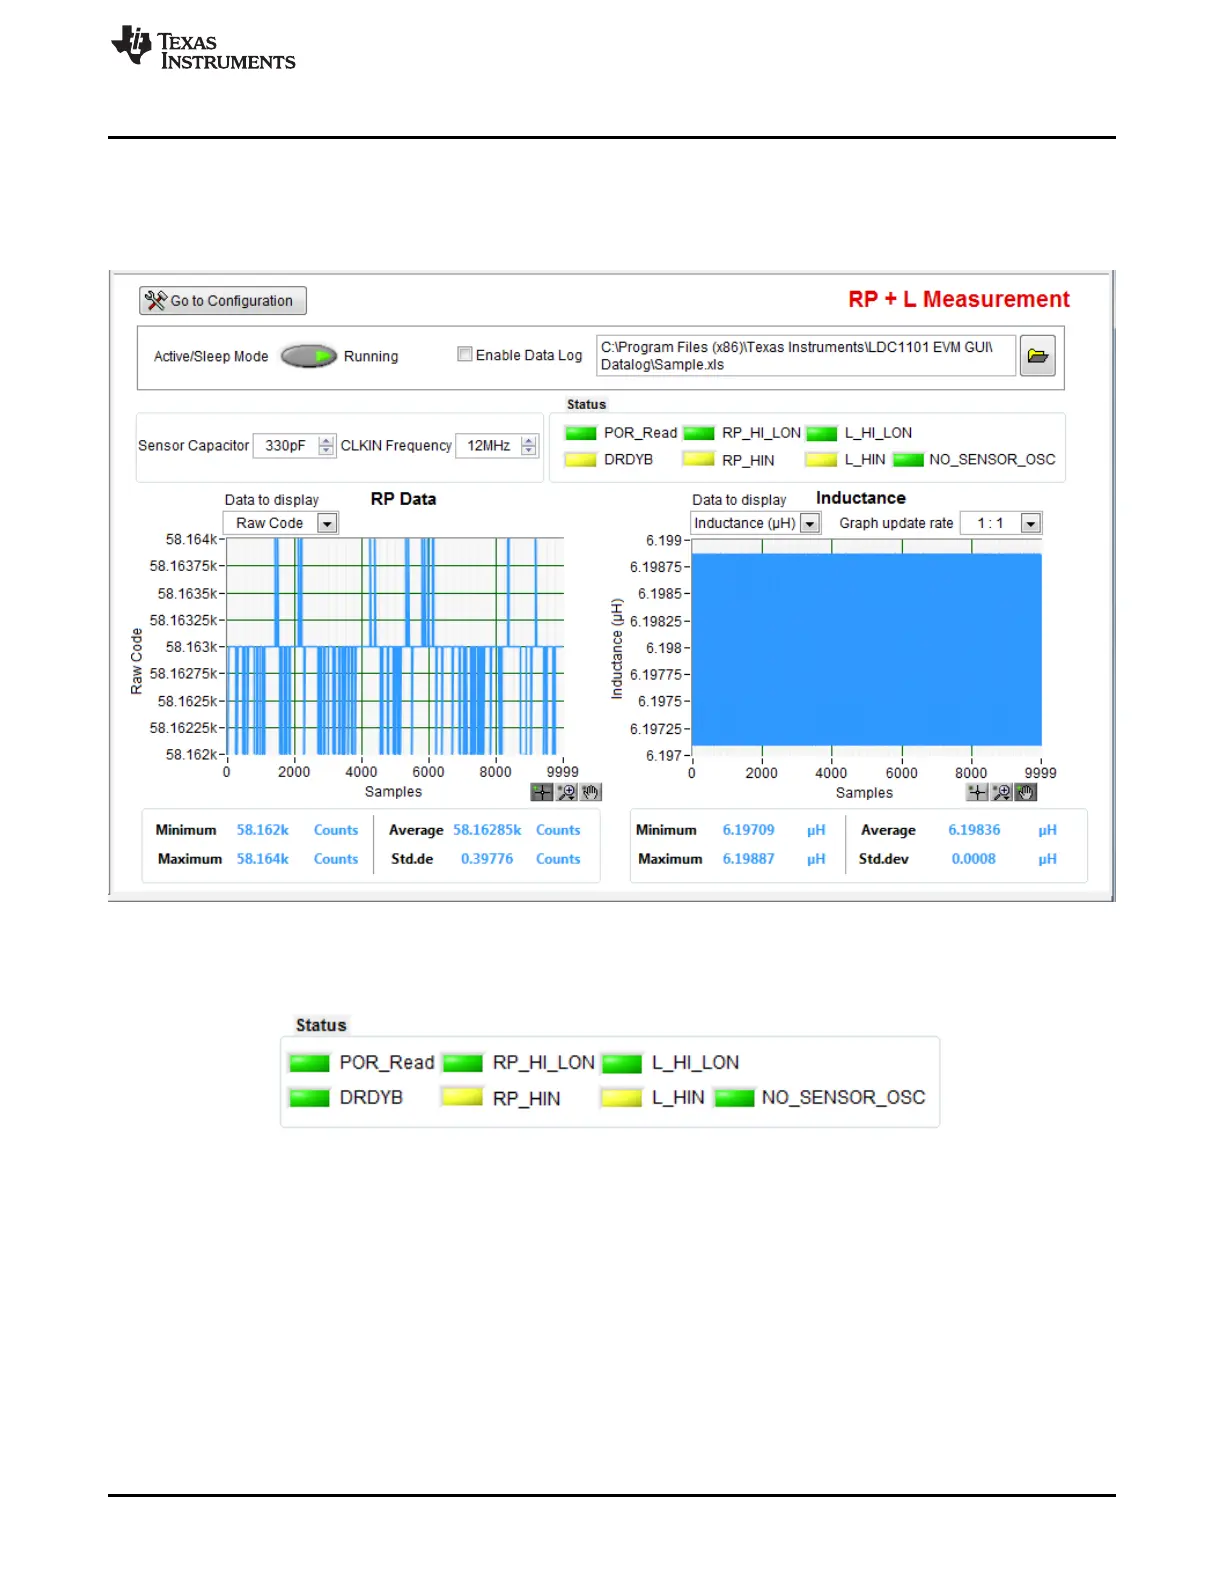
3.8 RP+L Page
The RP+L page allows for configuration of R
P
& Inductance measurements and plots conversion results.
The Streaming section displays the conversion results on two graphs. The left graph is the R
P
Data graph
and the right graph contains the Inductance graph.
Figure 3-11. LDC1101EVM Control Software: RP+L Page Streaming
Refer to Section 3.12 for information on the features and usage of the graphing areas.
Figure 3-12. RP+L Status
The LDC1101 Status Register (address 0x20) returns information on the measurement status. This status
is reported as a set of colored indicators in the Status Section, where Green indicates the condition was
not reported (the corresponding bit = 0).
17
SNOU137–May 2015 LDC1101EVM PC Software (GUI)
Submit Documentation Feedback
Copyright © 2015, Texas Instruments Incorporated