3-4 Function Graphing
8303FUNC.DOC TI-83 international English Bob Fedorisko Revised: 02/19/01 12:16 PM Printed: 02/19/01 1:35
PM Page 4 of 28
8303FUNC.DOC TI-83 international English Bob Fedorisko Revised: 02/19/01 12:16 PM Printed: 02/19/01 1:35
PM Page 4 of 28
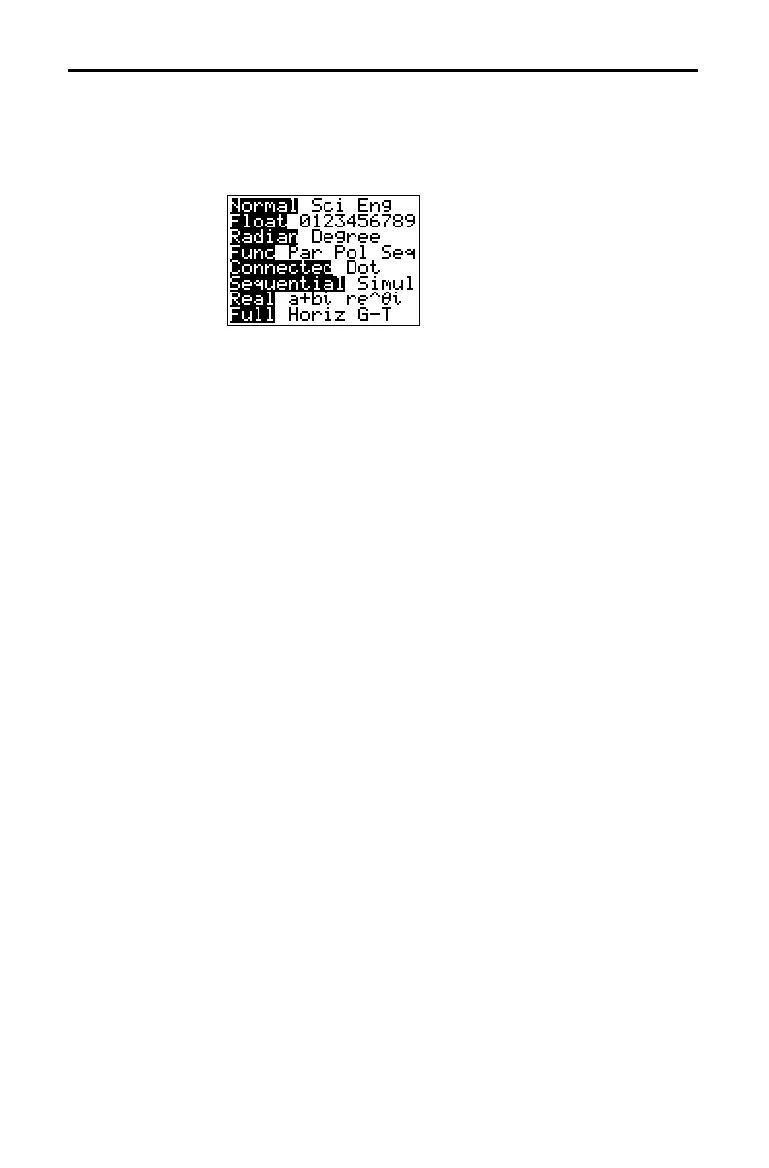
To display the mode screen, press
z
. The default
settings are highlighted below. To graph functions, you
must select
Func mode before you enter values for the
window variables and before you enter the functions.
The TI
-
83 has four graphing modes.
•
Func (function graphing)
•
Par (parametric graphing; Chapter 4)
•
Pol (polar graphing; Chapter 5)
•
Seq (sequence graphing; Chapter 6)
Other mode settings affect graphing results. Chapter 1
describes each mode setting.
•
Float or 0123456789 (fixed) decimal mode affects
displayed graph coordinates.
•
Radian or Degree angle mode affects interpretation of
some functions.
•
Connected or Dot plotting mode affects plotting of
selected functions.
•
Sequential or Simul graphing-order mode affects
function plotting when more than one function is
selected.
To set the graphing mode and other modes from a
program, begin on a blank line in the program editor and
follow these steps.
1. Press
z
to display the mode settings.
2. Press
†
,
~
,
|
, and
}
to place the cursor on the mode
that you want to select.
3. Press
Í
to paste the mode name to the cursor
location.
The mode is changed when the program is executed.
Setting the Graph Modes
Checking and
Changing the
Graphing Mode
Setting Modes
from a Program

 Loading...


