Statistics 12-37
8312STAT.DOC TI-83 international English Bob Fedorisko Revised: 02/19/01 12:42 PM Printed: 02/19/01 1:37
PM Page 37 of 38
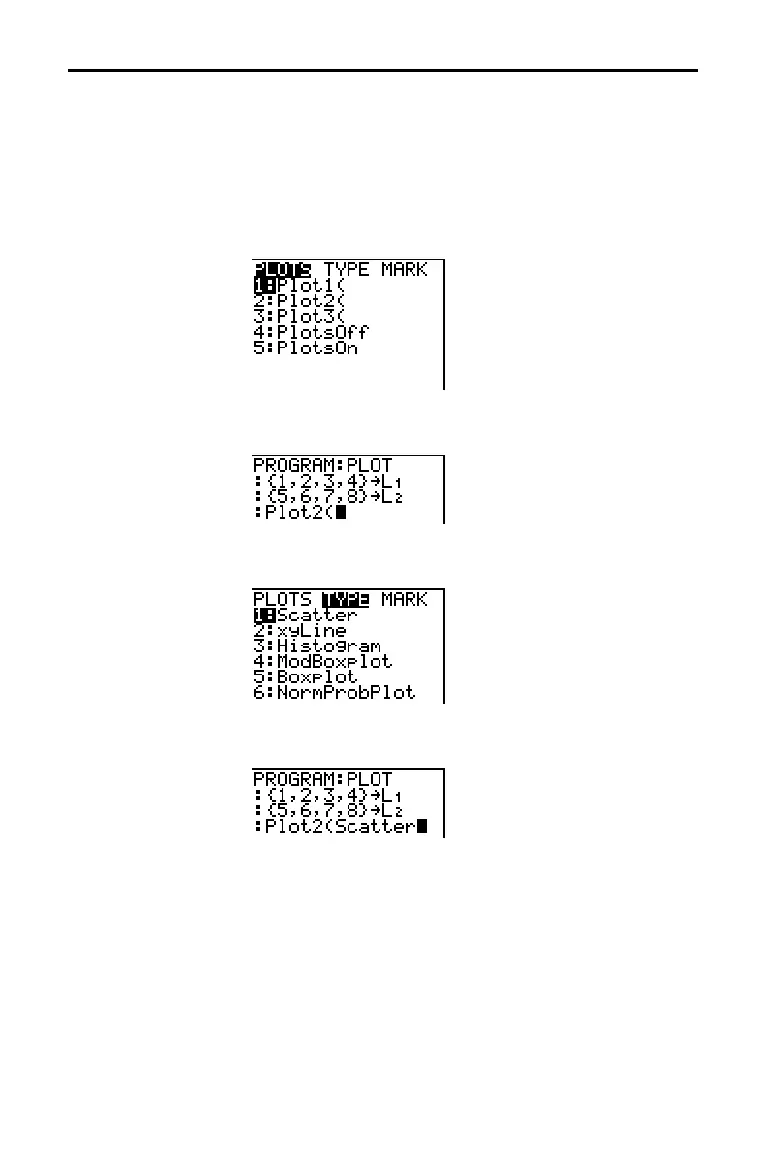
To display a stat plot from a program, define the plot, and
then display the graph.
To define a stat plot from a program, begin on a blank line
in the program editor and enter data into one or more lists;
then, follow these steps.
1. Press
y
[
STAT PLOT
] to display the
STAT PLOTS
menu.
2. Select the plot to define, which pastes Plot1(, Plot2(, or
Plot3( to the cursor location.
3. Press
y
[
STAT PLOT
]
~
to display the
STAT TYPE
menu.
4. Select the type of plot, which pastes the name of the
plot type to the cursor location.
Statistical Plotting in a Program
Defining a Stat
Plot in a Program

 Loading...


