Parametric Graphing 335
•Use the „ Zoom toolbar menu to zoom in or out on a portion of the graph.
•Use the ‡
Math toolbar menu to find derivatives, tangents, etc. Some menu items
are not available for parametric graphs.
Differences in Parametric and Function Graphing
This module assumes that you already know how to graph y(x) functions as described in
Basic Function Graphing. This section describes the differences that apply to parametric
equations.
Setting the Graph Mode
Use 3 to set
Graph = PARAMETRIC before you define equations or set Window
variables. The Y= Editor and the Window Editor let you enter information for the
current
Graph mode setting only.
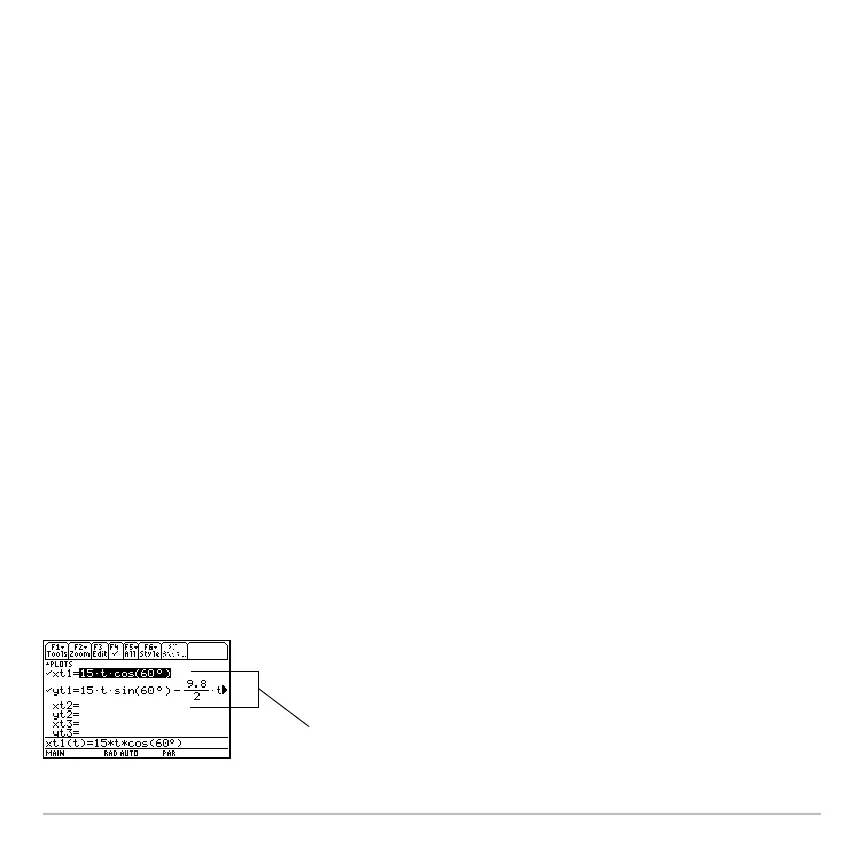
Defining Parametric Equations on the Y= Editor
To graph a parametric equation, you must define both its x and y components. If you
define only one component, the equation cannot be graphed. (However, you can use
single components to generate an automatic table as described in Tables.)
Enter x and y components on
separate lines.
You can define xt1(t) through
xt99(t) and yt1(t) through yt99(t).