Sequence Graphing 340
Sequence Graphing
Overview of Steps in Graphing Sequences
To graph sequences, use the same general steps used for y(x) functions as described in
Basic Function Graphing. Any differences are described on the following pages.
Graphing Sequences
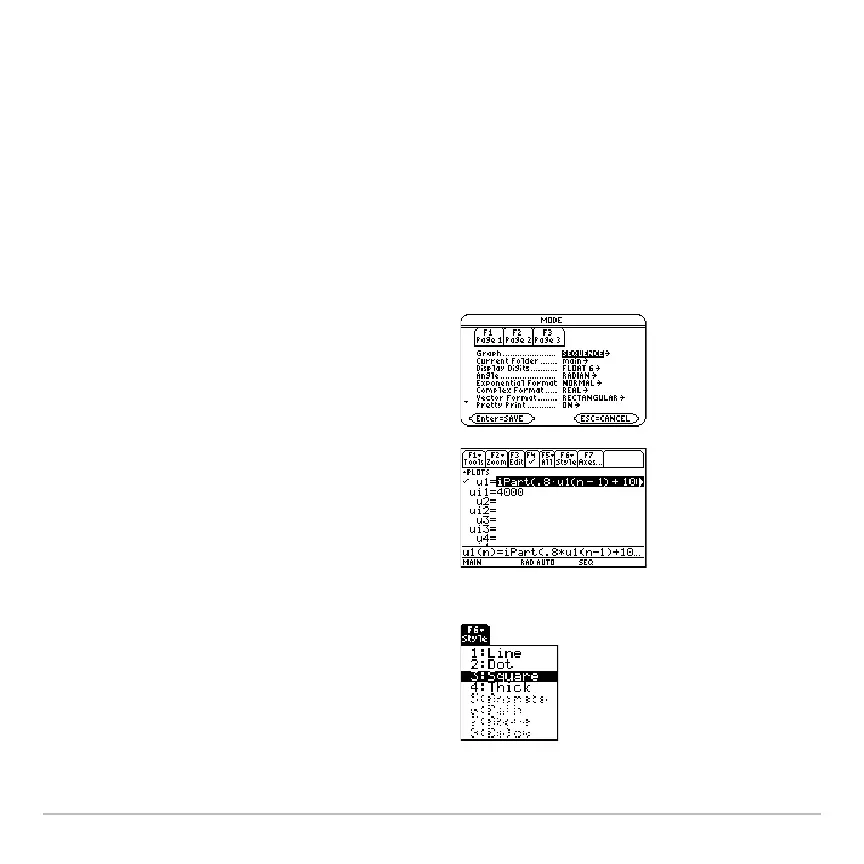
1. Set
Graph mode (3) to SEQUENCE.
Also set
Angle mode, if necessary.
2. Define sequences and, if needed, initial
values on Y= Editor (8#).
3. Select (†) which defined sequences to
graph. Do not select initial values.
Note: To turn off any stat data plots, press
‡ 5 or use † to deselect them.
4. Set the display style for a sequence.
2 ˆ
For sequences, the default style is
Square.