Sequence Graphing 341
Exploring the Graph
From the Graph screen, you can:
• Display the coordinates of any pixel by using the free-moving cursor, or of a plotted
point by tracing a sequence.
•Use the „
Zoom toolbar menu to zoom in or out on a portion of the graph.
•Use the ‡
Math toolbar menu to evaluate a sequence. Only 1:Value is available for
sequences.
• Plot sequences on
Time (the default), Web, or Custom axes.
Note: You can also evaluate a sequence while tracing. Simply enter the n value directly
from the keyboard.
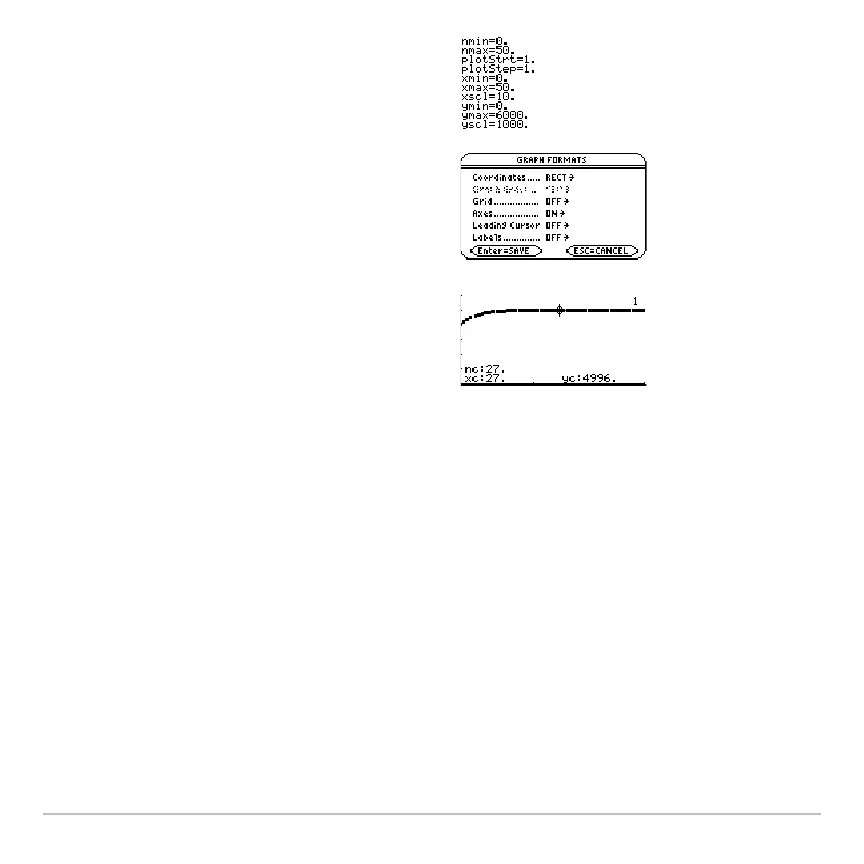
5. Define the viewing window (8$).
„
Zoom also changes the viewing
window.
6. Change the graph format if necessary.
,
9
— or —
8 Í
7. Graph the selected equations
(8%).