Basic Function Graphing 290
•Use the ‡ Math toolbar menu to find a zero, minimum, maximum, etc.
Setting the Graph Mode
Before graphing y(x) functions, you must select FUNCTION graphing. You may also
need to set the Angle mode, which affects how the TI-89 Titanium graphs trigonometric
functions.
Graph Mode
2. Set the Graph mode to
FUNCTION. Refer to “Setting Modes” in Operating the
Calculator.
For graphs that do not use complex numbers, set
Complex Format = REAL.
Otherwise, it may affect graphs that use powers, such as
x
1/3
.
While this module specifically describes
y(x) function graphs, the calculator lets you
select from six Graph mode settings.
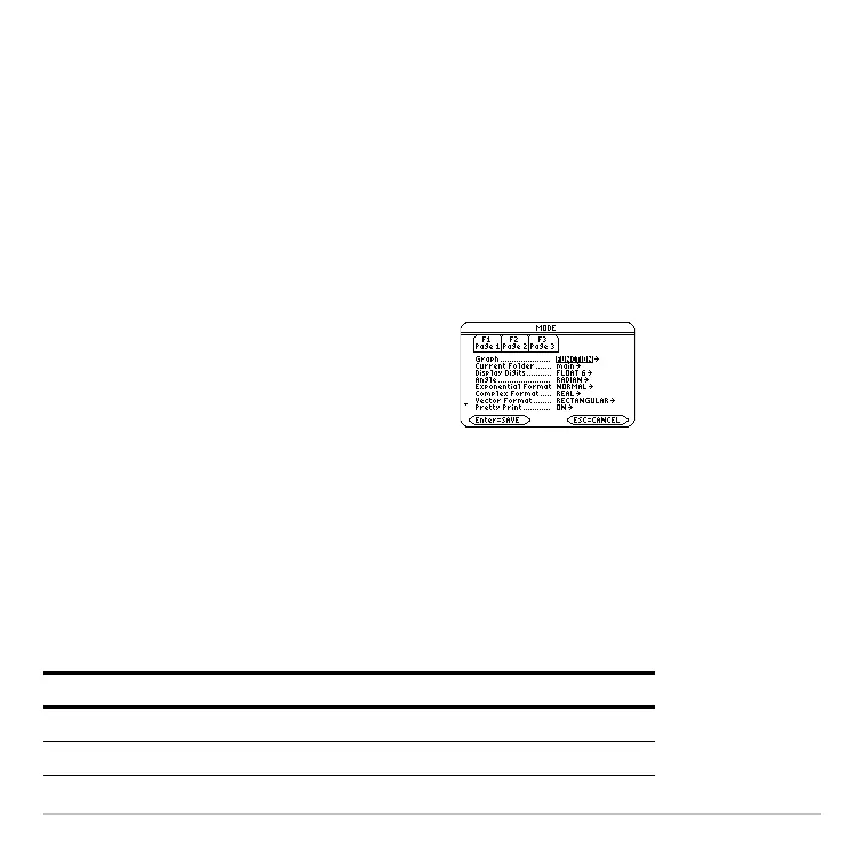
1. Press 3 to display the
MODE dialog
box, which shows the current mode
settings.
Graph Mode Setting Description
FUNCTION y(x) functions
PARAMETRIC x(t) and y(t) parametric equations