Differential Equation Graphing 420
Setting Axes for Time or Custom Plots
Setting the axes can give you great flexibility in graphing differential equations. Custom
axes are particularly effective for showing different kinds of relationships.
Displaying the AXES Dialog Box
From the Y= Editor, press:
@2 ‰
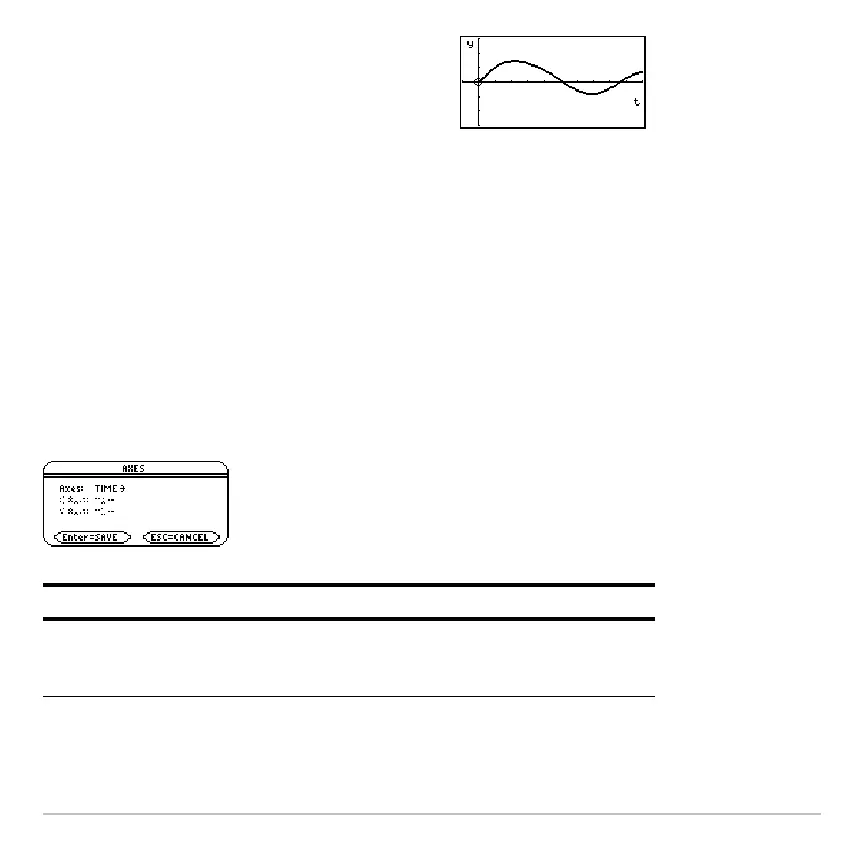
9. Display the Graph screen (8%).
Note: To find the solution at a particular
time, use … to trace the graph.
If
Fields = SLPFLD, Axes is unavailable.
@2 ‰
Item Description
Axes TIME — Plots t on the x axis and y (solutions to all selected
differential equations) on the y axis.
CUSTOM — Lets you select the x and y axes.