Statistics and Data Plots 525
Statistics and Data Plots
Overview of Steps in Statistical Analysis
This section gives an overview of the steps used to perform a statistical calculation or
graph a statistical plot. For detailed descriptions, refer to the following pages.
1. Set Graph mode (3) to
FUNCTION.
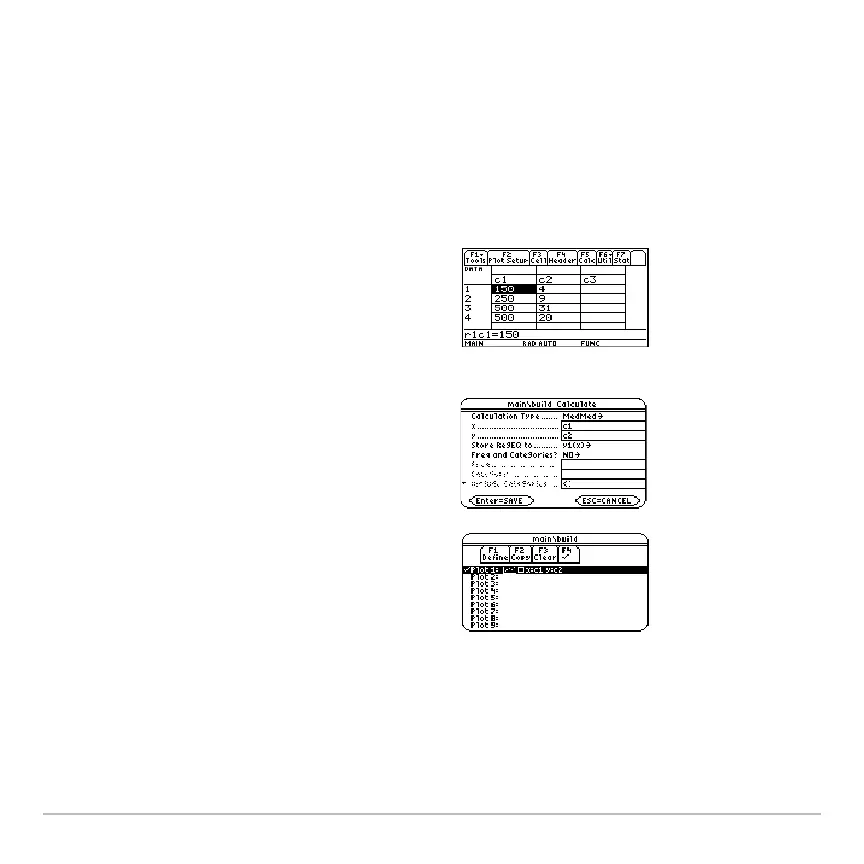
2. Enter stat data in the Data/Matrix Editor.
Note: Refer to the Data/Matrix Editor
module for details on entering data in the
Data/Matrix Editor.
3. Perform stat calculations to find stat
variables or fit data to a model (‡).
4. Define and select stat plots („
and then
,).
Note: You can also use the Y= Editor to
define and select stat plots and
y(x)
functions.
5. Define the viewing window (8$).