Statistics and Data Plots 537
4. Specify applicable settings for the active items.
Note:
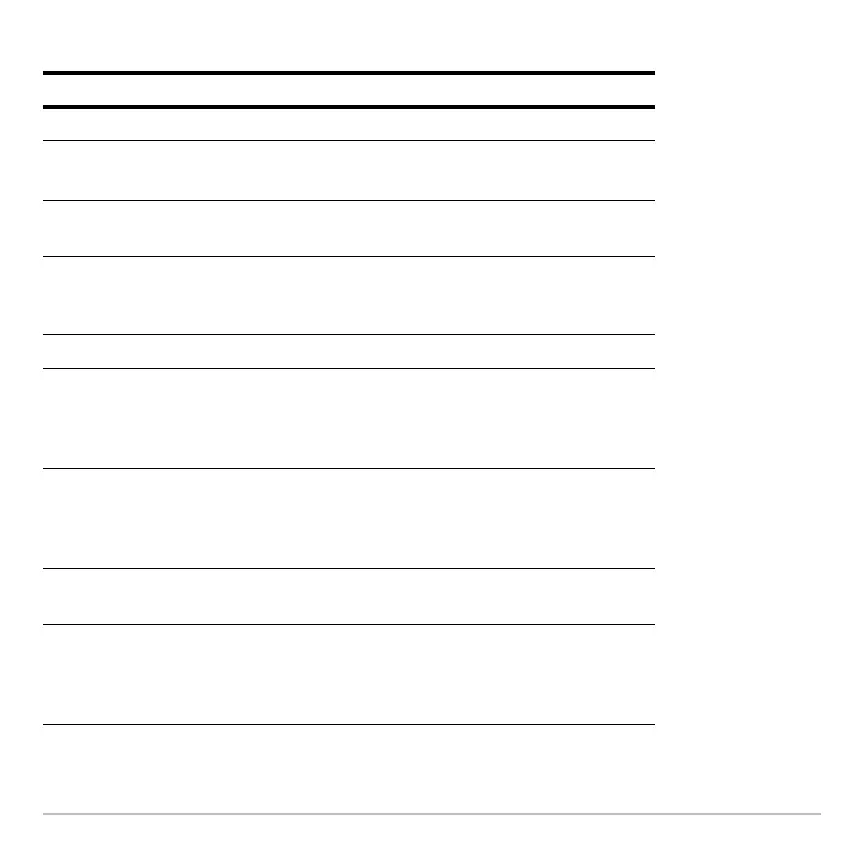
Item Description
Plot Type Select the type of plot.
Mark
Select the symbol used to plot the data points: Box (›),
Cross (x), Plus (+), Square (
0), or Dot (¦).
x Type the column number in the Data/Matrix Editor (C1,
C2, etc.) used for x values, the independent variable.
y Type the column number used for y values, the
dependent variable. This is active only for Plot Type =
Scatter or xyline.
Hist. Bucket Width Specifies the width of each bar in a histogram.
Freq and
Categories?
Select NO or YES. Note that Freq, Category, and
Include Categories are active only when Freq and
Categories? = YES. (Freq is active only for Plot Type =
Box Plot or Histogram.)
Freq Type the column number that contains a “weight” value
for each data point. If you do not enter a column
number, all data points are assumed to have the same
weight (1).
Category Type the column number that contains a category value
for each data point.
Include
Categories
If you specify a Category, you can use this to limit the
calculation to specified category values. For example, if
you specify {1,4}, the plot uses only data points with a
category value of 1 or 4.
 Loading...


