Appendix A: Functions and Instructions 833
Note:
list1
through
list4
must be a variable name or
c1–c99. (columns in the last data variable shown in
the Data/Matrix Editor).
list5
does not have to be a
variable name and cannot be c1–c99.
¸
Regeq(x)"y1(x)
¸ Done
NewPlot 1,1,L1,L2
¸ Done
¥%
QuartReg MATH/Statistics/Regressions menu
QuartReg
list1
,
list2
[, [
list3
] [,
list4
,
list5
]]
Calculates the quartic polynomial regression and
updates the system statistics variables.
All the lists must have equal dimensions except for
list5
.
list1
represents xlist.
list2
represents ylist.
list3
represents frequency.
list4
represents category codes.
list5
represents category include list.
Note:
list1
through
list4
must be a variable name or
c1–c99 (columns in the last data variable shown in
the Data/Matrix Editor).
list5
does not have to be a
variable name and cannot be c1–c99.
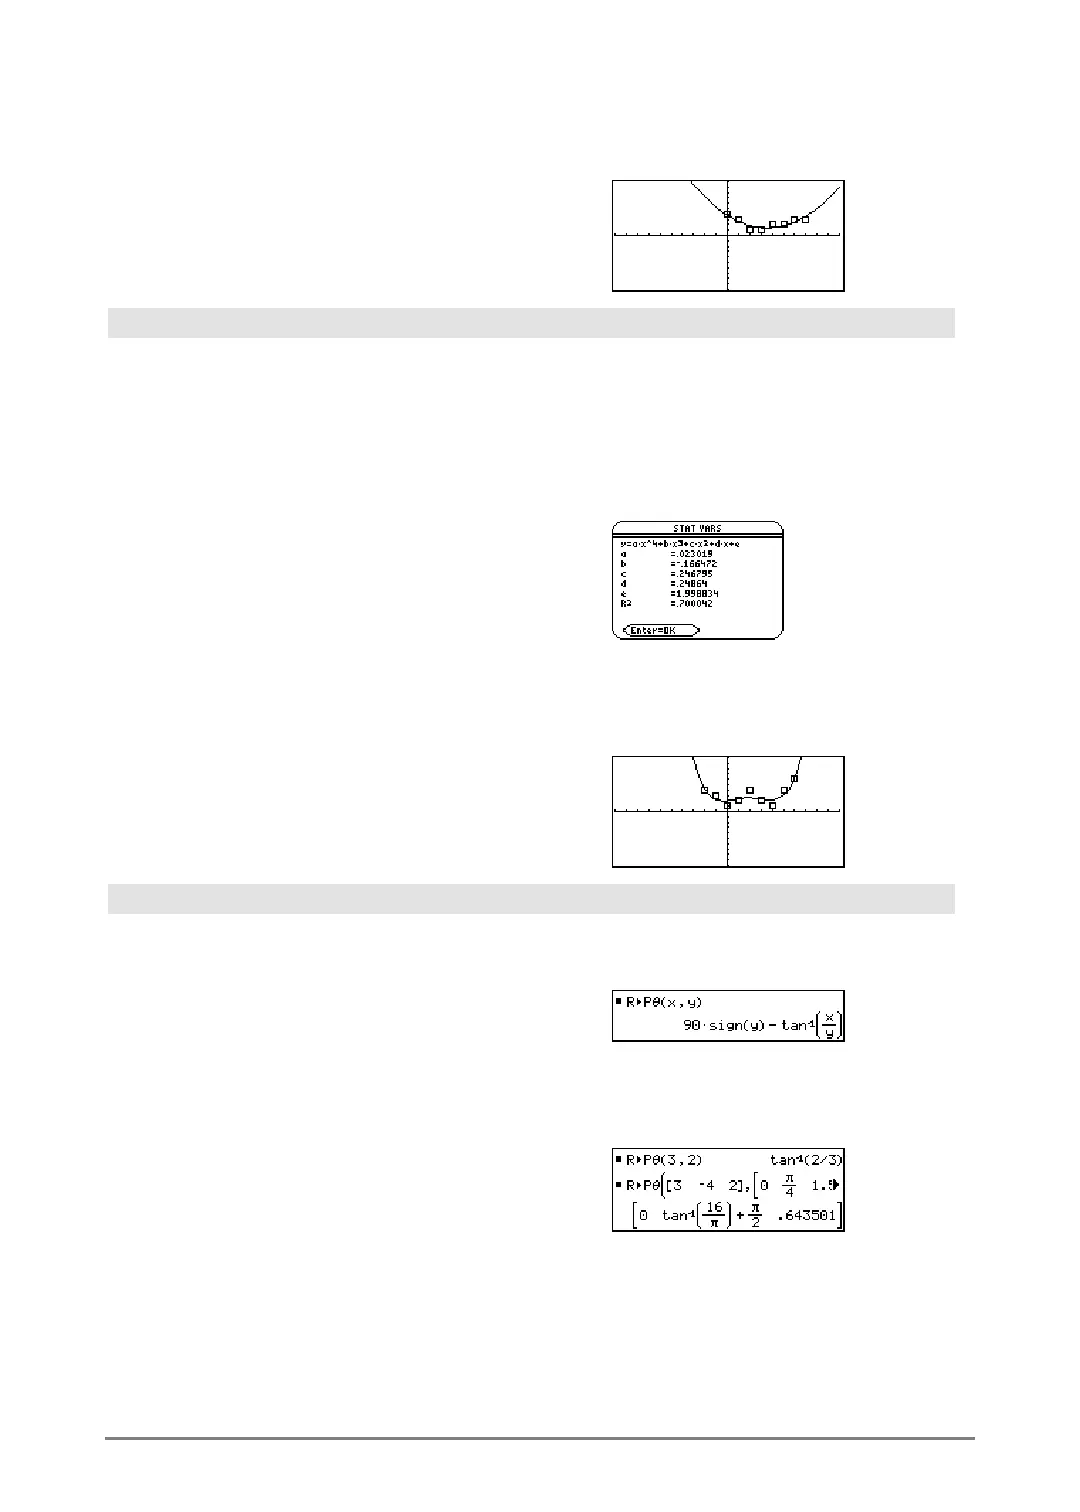
In function graphing mode:
{ë 2,ë 1,0,1,2,3,4,5,6}! L1
¸
{ë 2 ë 1 0
...
}
{4,3,1,2,4,2,1,4,6}! L2
¸
{4 3 1
...
}
QuartReg L1,L2
¸ Done
ShowStat
¸
¸
Regeq(x)"y1(x)
¸ Done
NewPlot 1,1,L1,L2
¸ Done
¥%
R4Pq() MATH/Angle menu
R4Pq (
xExpression
,
yExpression
) ⇒
expression
R4Pq (
xList
,
yList
) ⇒
list
R4Pq (
xMatrix
,
yMatrix
) ⇒
matrix
Returns the equivalent
q
-coordinate of the
(
x,y
) pair arguments.
Note: The result is returned as either a degree or
radian angle, according to the current angle mode.
In Degree angle mode:
R8Pq(x,y)
¸
In Radian angle mode:
R4Pq(3,2)
¸
R4Pq([3,-4,2],[0,pà4,1.5])
¸