Feedback Controlyzer DigiLock 110
Page 30
Status: 5.12.17
8.2.3 Response (Network Analysis)
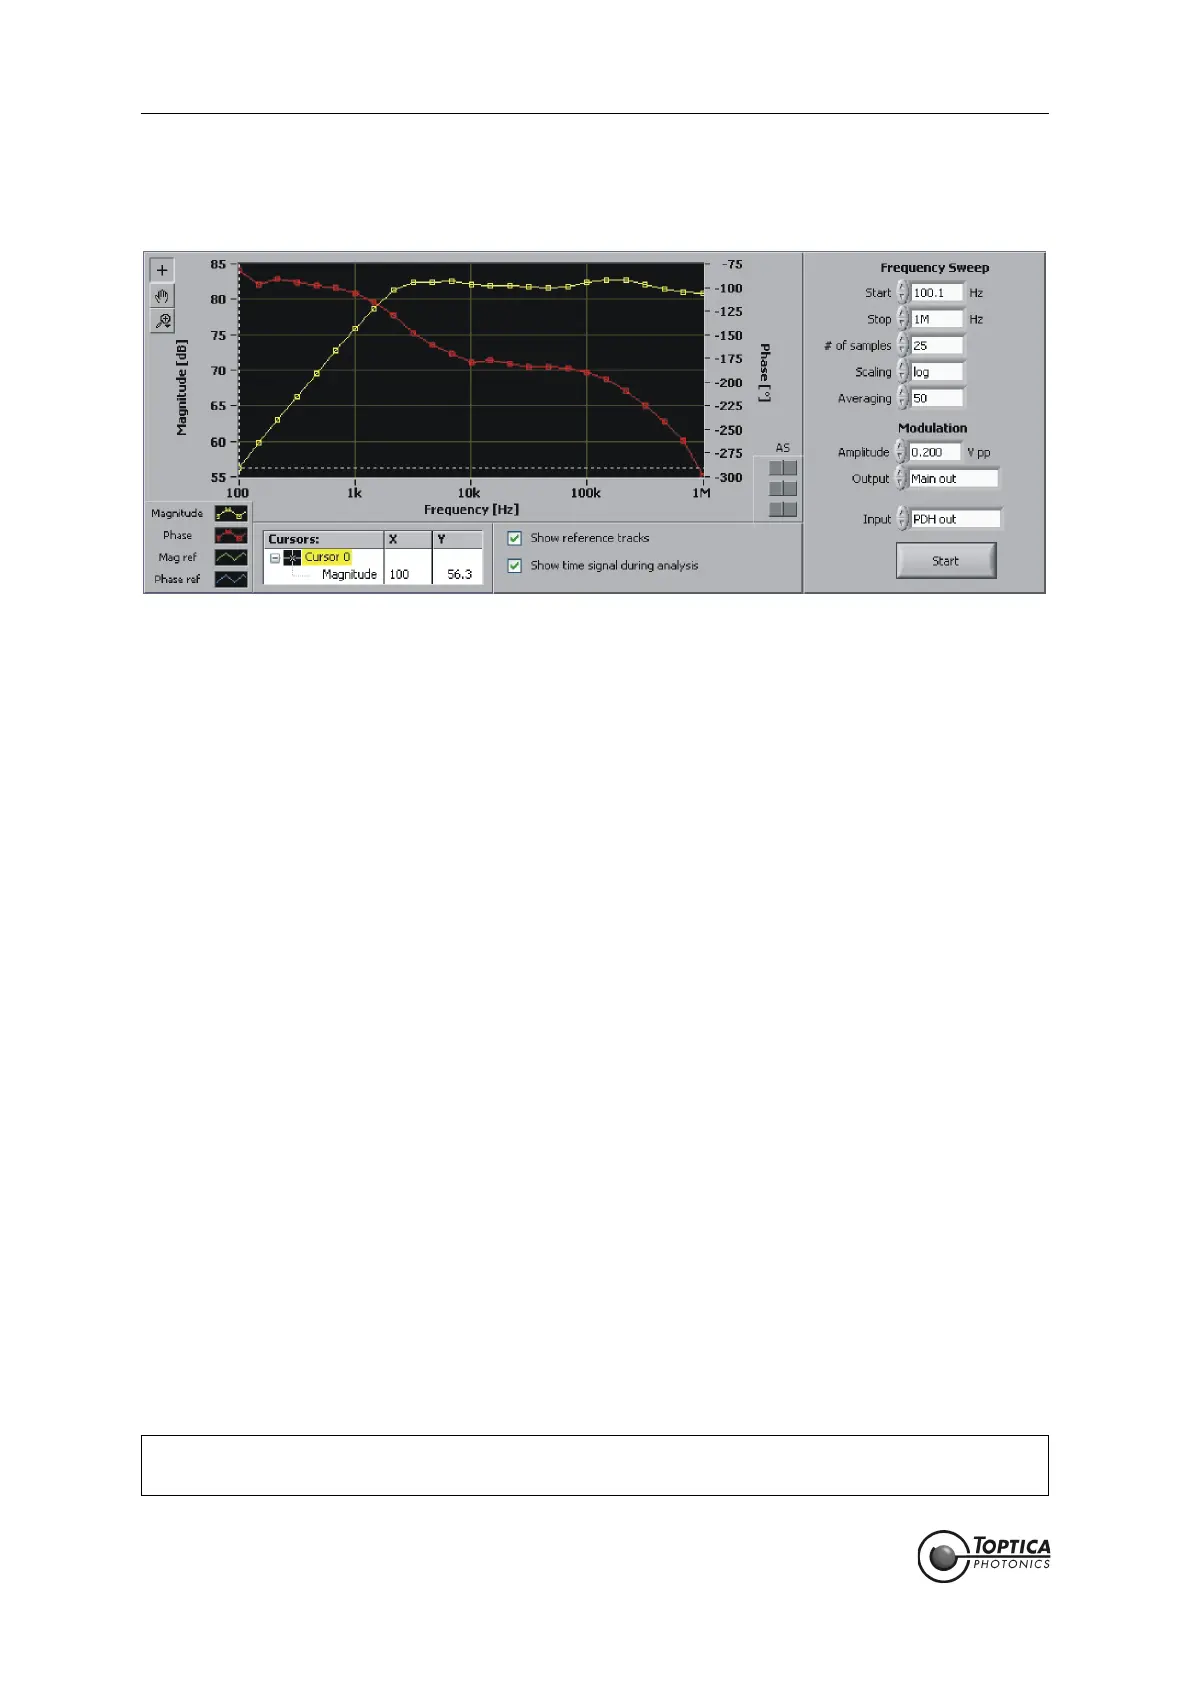
Figure 18 Response of the system to an additional sinosoidal pertubation (network analysis)
In order to determine the dynamic behavior of a system, it is a common strategy to perform a network
analysis, i.e. to measure the frequency response to a swept sinosoidal pertubation. The result of such an
analysis is the transfer function of the device under test (DUT) defined by the amplitude and phase values
with respect to the frequency of the stimulus. In particular it is possible to analyze the complete feedback
loop comprising of frequency discriminator, detector, controller and actuator.
How it works:
An additional modulation is applied to the DUT via the selected output. The response of the DUT is ana-
lyzed in amplitude and phase with respect to the applied stimulus. The resulting transfer function is dis-
played with respect to the frequency of the stimulus.
Frequency Sweep
Start: Start frequency of the stimulus.
Stop: Stop frequency of the stimulus.
# of samples: Number of measurement points between the start and stop frequency.
Scaling: Method to distribute the measurement points between the start and
stop frequency (logarithmic or linear).
Averaging: Number of measurements to average for one resulting measurement
value.
Modulation
Amplitude: Amplitude (peak-to-peak) of the stimulus signal.
Output: Output channel for the stimulus signal.
Input: Input channel for the response signal.
Start: Starts the measurement.
Show reference tracks: Option to display reference tracks saved before.
Show time signal
during analysis: Option to view the response signal in the Scope display during the mea-
surement (the Scope display must be selected manually by the user).
NOTE ! Any filters applied to the signal path (see Figure 19) will affect the measured transfer func-
tion.
 Loading...