10. Application Examples
Page 53
Status: 5.12.17
10.2 Doppler-Free Saturation Spectroscopy
After realizing the initial setup in section 10.1 this section describes the stabilization to an atomic transition
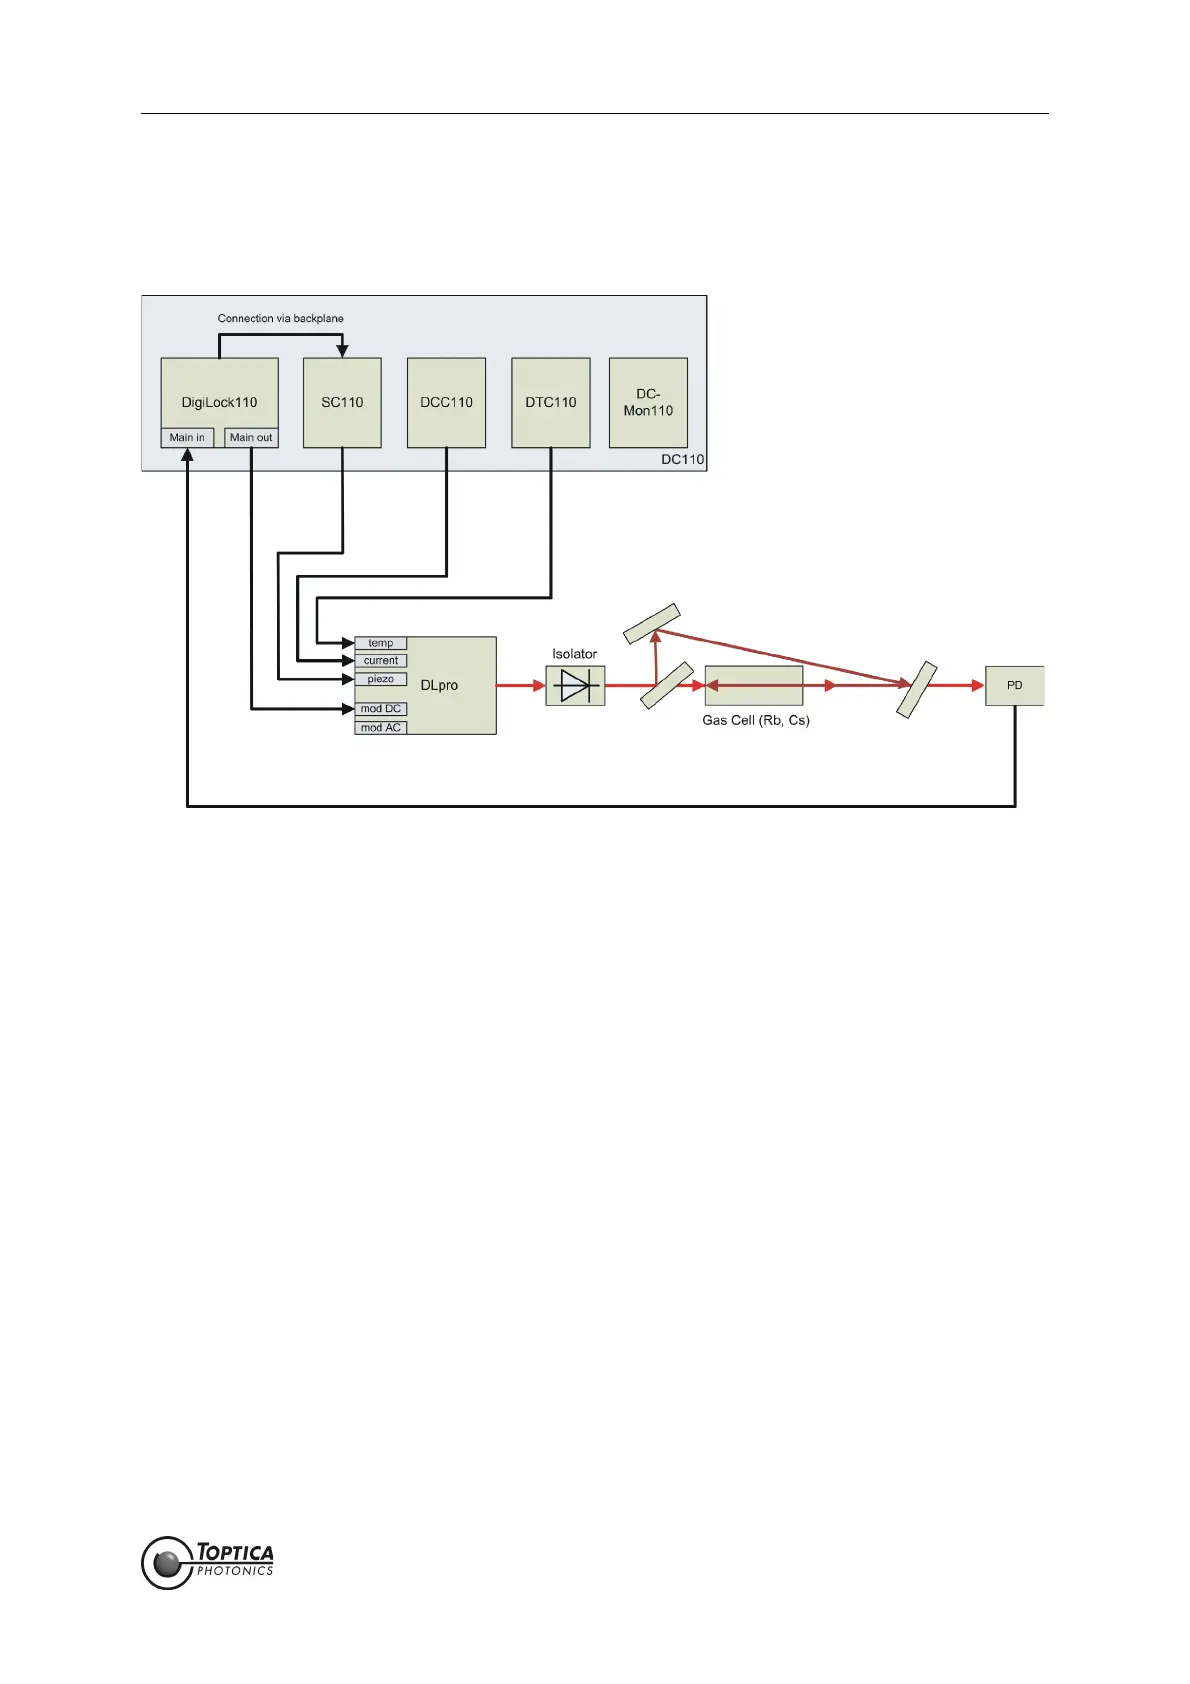
by Doppler-free saturation spectroscopy of Rb. Figure 38 shows the experimental setup.
Figure 38 Experimental setup for Doppler-free saturation spectroscopy
Once the Doppler-free saturation spectroscopy is adjusted and the laser is tuned to the appropriate
transition, the photodetector signal at the Main in connector (4, in Figure 4) can be optimized by scan-
ning the laser wavelength across the desired resonance.
13. To scan the laser with the piezo, use the Scan module of the DigiLock User Interface (DUI) (see Fig-
ure 9). Select <SC 110 out> as output, set the signal type to triangle, the frequency to 10 Hz and
the amplitude in the order of 10 Volts. Depending on the laser this corresponds to several GHz of
frequency tuning. Switch on the scan by pressing the Scan button.
14. The Scope display provides a two channel oscilloscope and is a general tool to view a variety of
signals of the DigiLock 110. To display the spectroscopy signal use a timescale of 50 ms (corre-
sponding to the 10 Hz scan frequency), choose <Main in> as CH 1 and <SC 110 out> as CH 2. The
scope triggers on the rising slope of the internal scan ramp.
The signal expected after the adjustment will look similar to the one shown in Figure 39.
 Loading...