Feedback Controlyzer DigiLock 110
Page 40
Status: 5.12.17
8.3.3 Spectrum
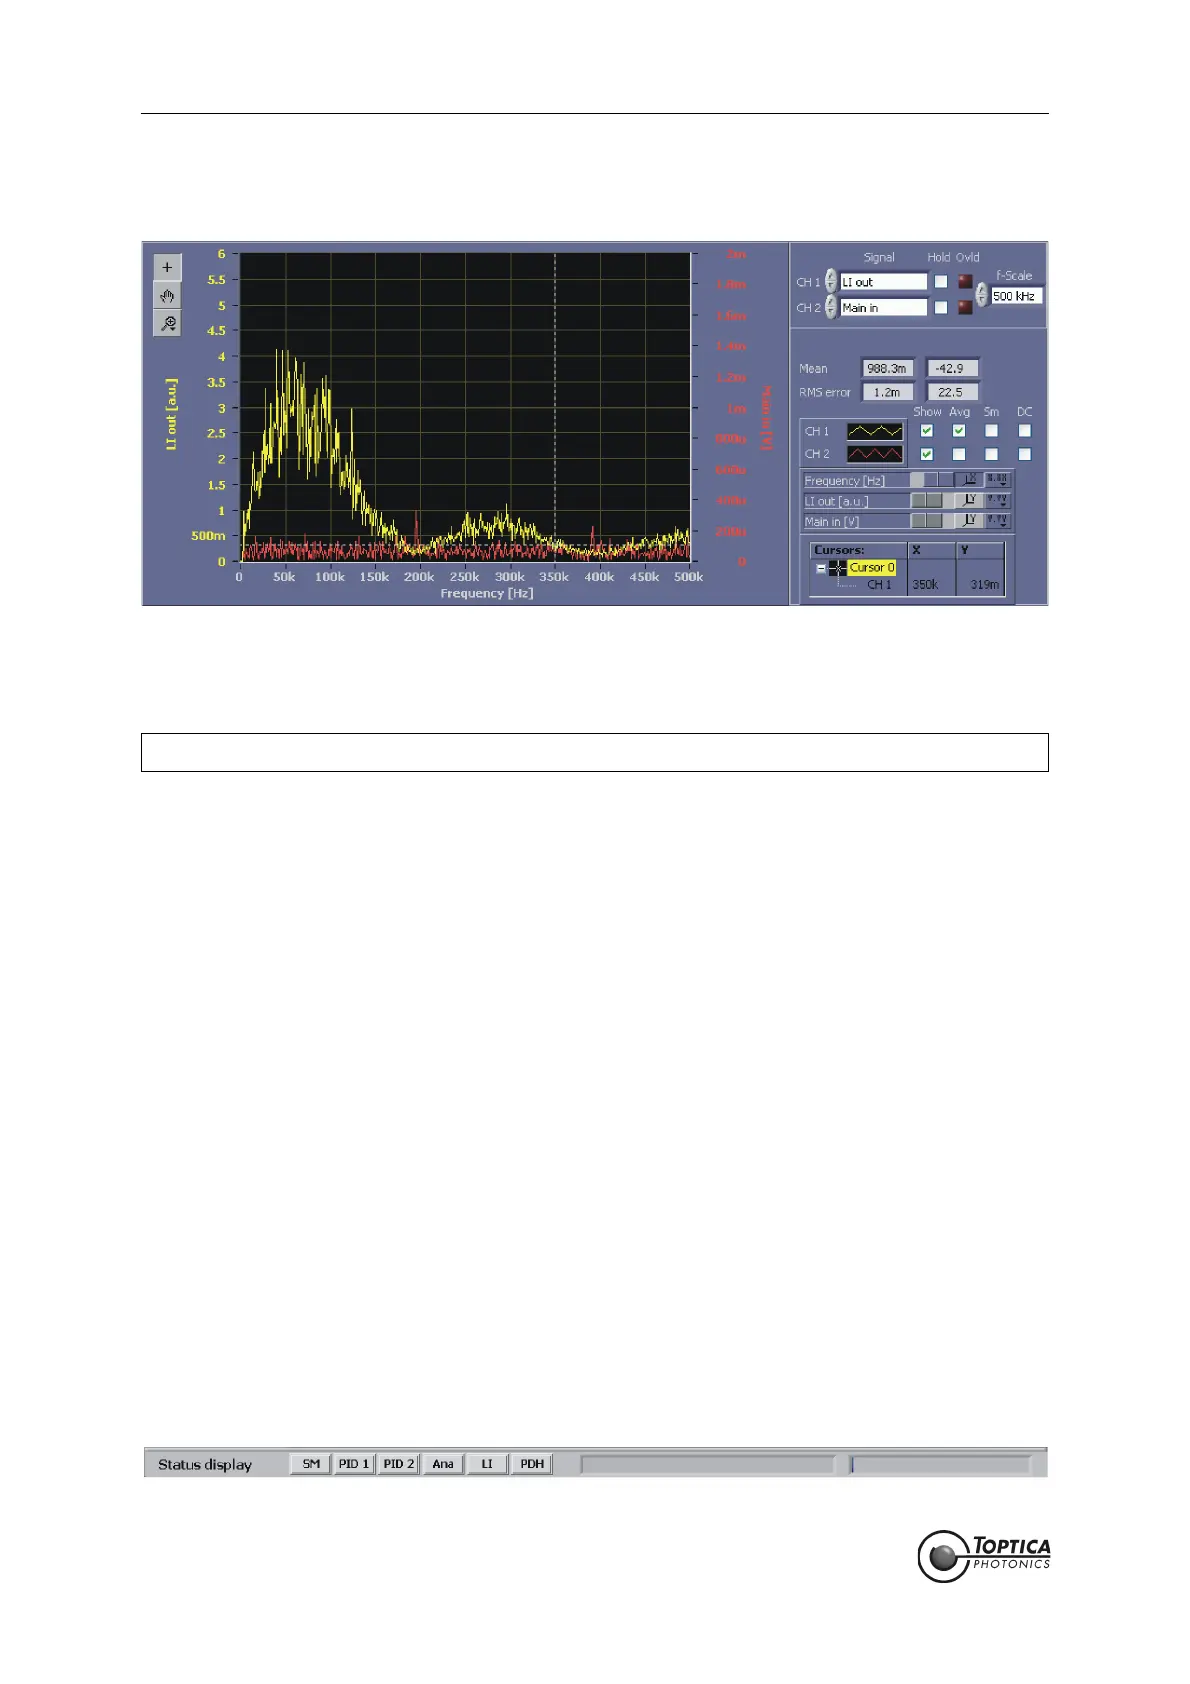
Figure 30 Spectrum display
The Spectrum displays the fast fourier transform (FFT) of the signal. The functionality is similar to the Scope
display but in the frequency domain.
CH 1: Signal displayed on channel 1.
CH 2: Signal displayed on channel 2.
Hold: Freezes the trace for this channel.
Ovld: Indicates whether the selected channel was at its limits during the last
acquisition.
f-scale: Frequency span displayed on the frequency axis. Within this range 500
measurement points are calculated from a time signal of 1000 measure-
ment points (sample rate = 2 x f-scale).
Mean: Mean value calculated from the time signal for channel 1 and channel
2, respectively.
RMS-error: RMS value calculated from the difference between the time signal and
its mean value for channel 1 and channel 2, respectively.
Show: Shows or hides the trace.
Avg: Option to average consecutive frequency spectra of a channel (the
number of traces for the average can be set in the Advanced Settings
(see section 8.2.5.4).
Sm: Smoothing trace using nearest neighbor averaging. The number of
points for the average can be set in the Advanced Settings (see section
8.2.5.4).
DC: Include DC contribution of the frequency analysis. Note that the DC
part is usually much bigger than the signal in the frequency range of
interest. Hence, suppressing the DC part allows to use the autoscaled
signal for analysis.
8.4 Status Display
On the bottom of the window the status bar displays the current state of the most important modules, sys-
tem messages and a progress bar used for time consuming processes.
Figure 31 Status display
NOTE ! The selected frequency range defines the sampling rate of the signal used for the FFT.
 Loading...