Feedback Controlyzer DigiLock 110
Page 44
Status: 5.12.17
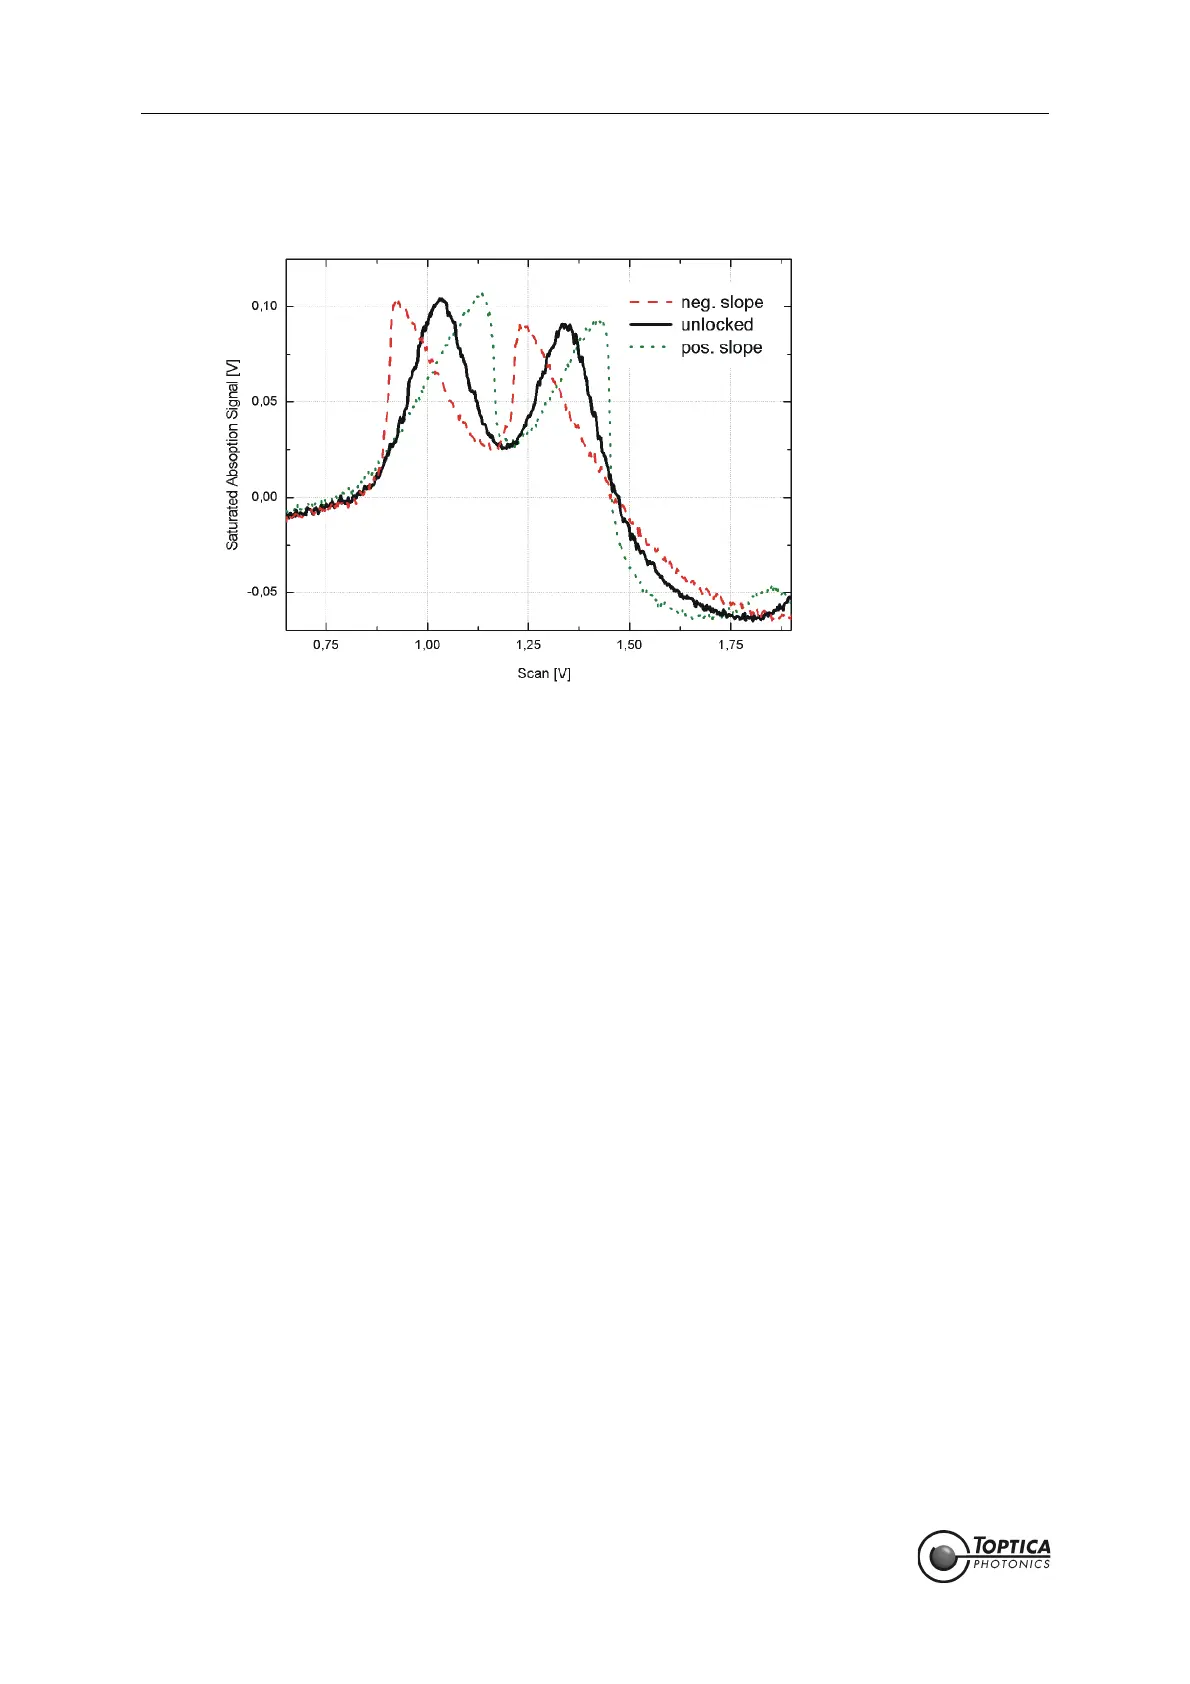
Figure 32 Polarity of the PID controller for side of fringe lock
The graph shows the characteristic distortions of the error signal of a side of fringe lock for dif-
ferent polarities. The displayed example is a zoom into the saturated absorption spectros-
copy of Rb. The undistorted signal (solid black) is given for reference. When the polarity is
chosen to lock on a negative slope (dashed red), the negative slopes are shallower/broader
while the positive slopes are steeper/narrower. The opposite is true for locking onto the posi-
tive slopes (dotted green). The traces have successively been exported from the Scope dis-
play of the DigiLock 110 (right click on scope graph).
 Loading...