Start-Up and Shutdown
RTAF-SVX001A-EN 51
Sequence of Operation
This section will provide basic information on chiller
operation for common events. With microelectronic
controls, ladder diagrams cannot show today’s complex
logic, as the control functions are much more involved
than older pneumatic or solid state controls.
Adaptive control algorithms can also complicate the exact
sequence of operations.This section illustrates common
control sequences.
Software Operation Overview
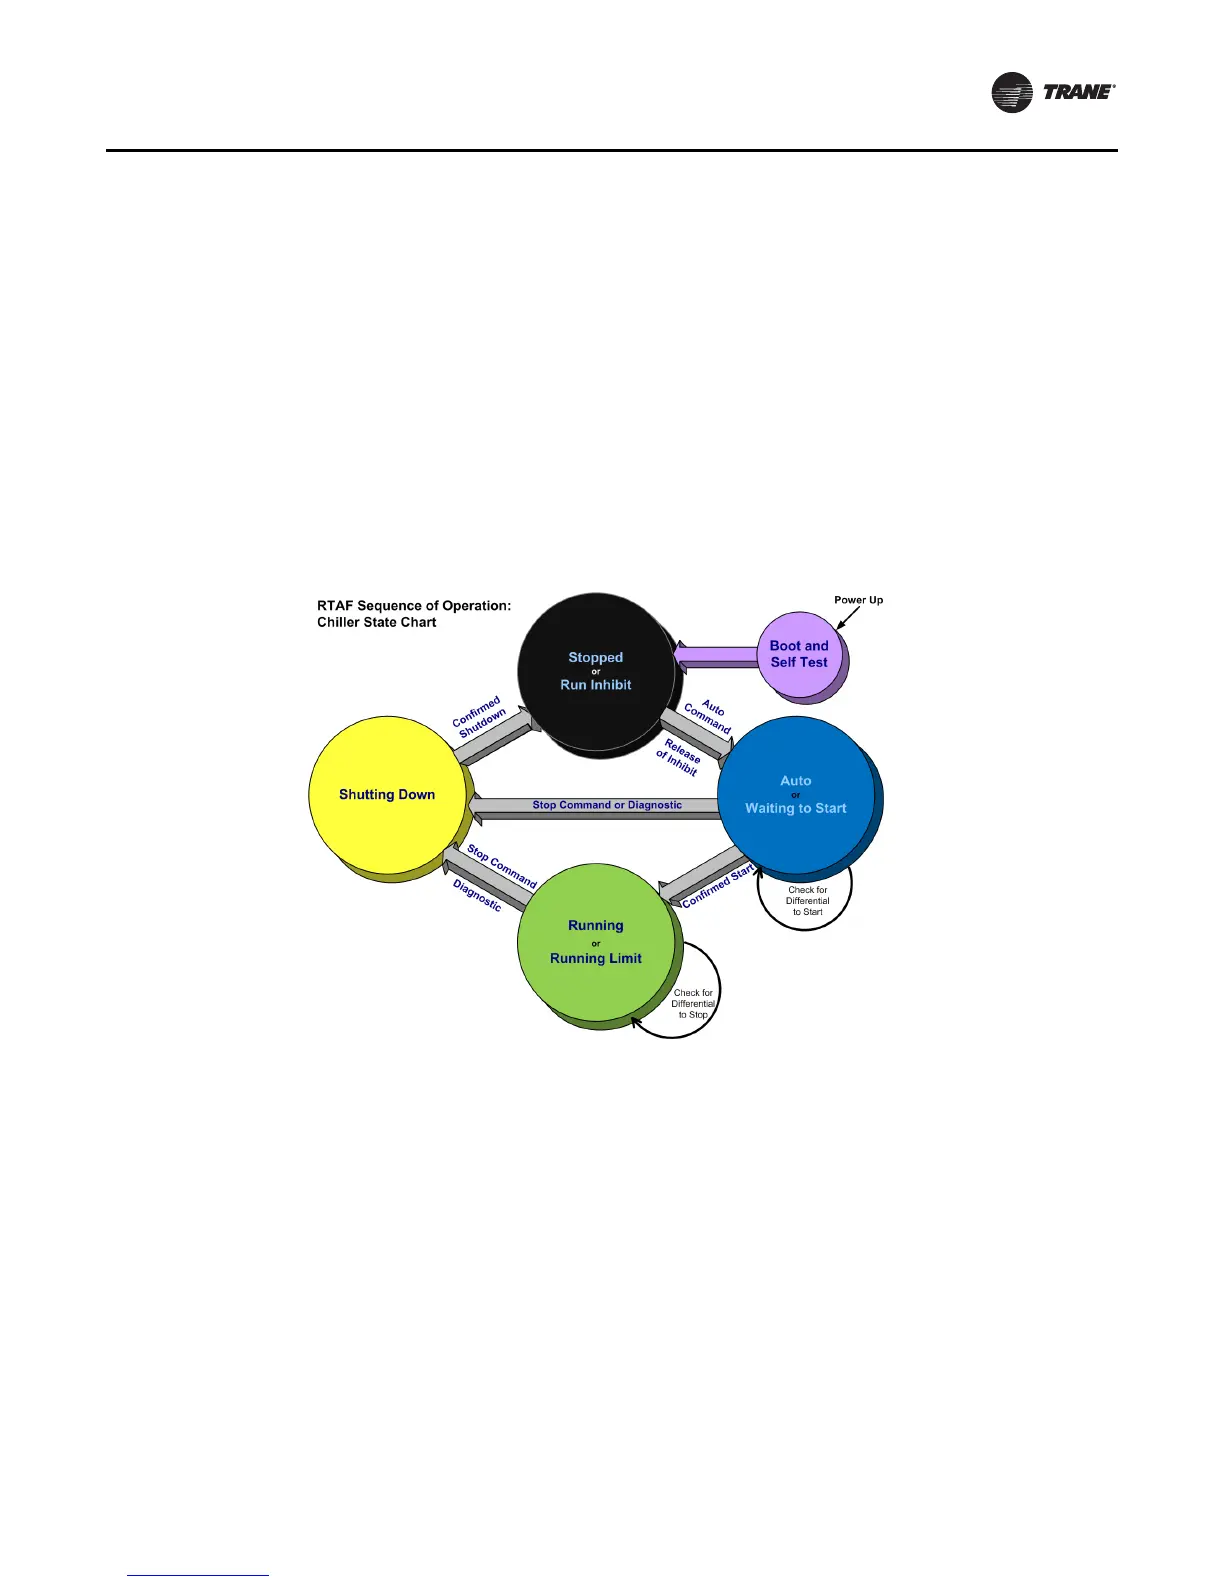
The Software Operation Overview shown in Figure 42,
p. 51 is a diagram of the five possible software states.This
diagram can be though of as a state chart, with the arrows
and arrow text depicting the transitions between states.
• The text in the circles is the visible top level operating
modes that are displayed onTracer™ AdaptiView.
• The shading of each software state circle corresponds
to
the shading on the time lines that show the state the
chiller is in.
There are five generic states that the software can be in:
• Power Up
• Stopped
• Starting
• Running
• Stopping
•
Timelines
• The time line indicates the upper level operating mode,
as it would be viewed on theTracer™ AdaptiView.
• The shading color of the cylinder indicates the
sof
tware state.
• Text in parentheses indicates sub-mode text as viewed
on
Tracer AdaptiView.
• Text above the time line cylinder is used to illustrate
inputs
to the Main Processor. This may include user
input to theTracer AdaptiViewTouch screen, control
inputs from sensors, or control inputs from a Generic
BAS.
• Boxes indicate control actions such as turning on
relays,
or pulsing compressor load or unload
solenoids.
• Smaller cylinders under the main cylinder indicate
diagnostic
checks.
• Text outside a box or cylinder indicates time based
functions.
• Solid double arrows indicate fixed timers.
Dashed double arrows indicate variable timers.
Figure 42. Software operation overview Figure 42