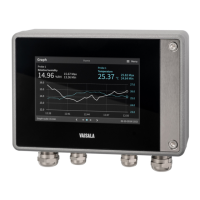
4.4 Measurements View
Figure 18 Measurements View (Desktop Browser)
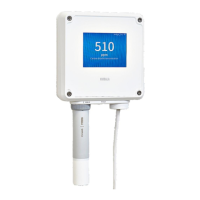
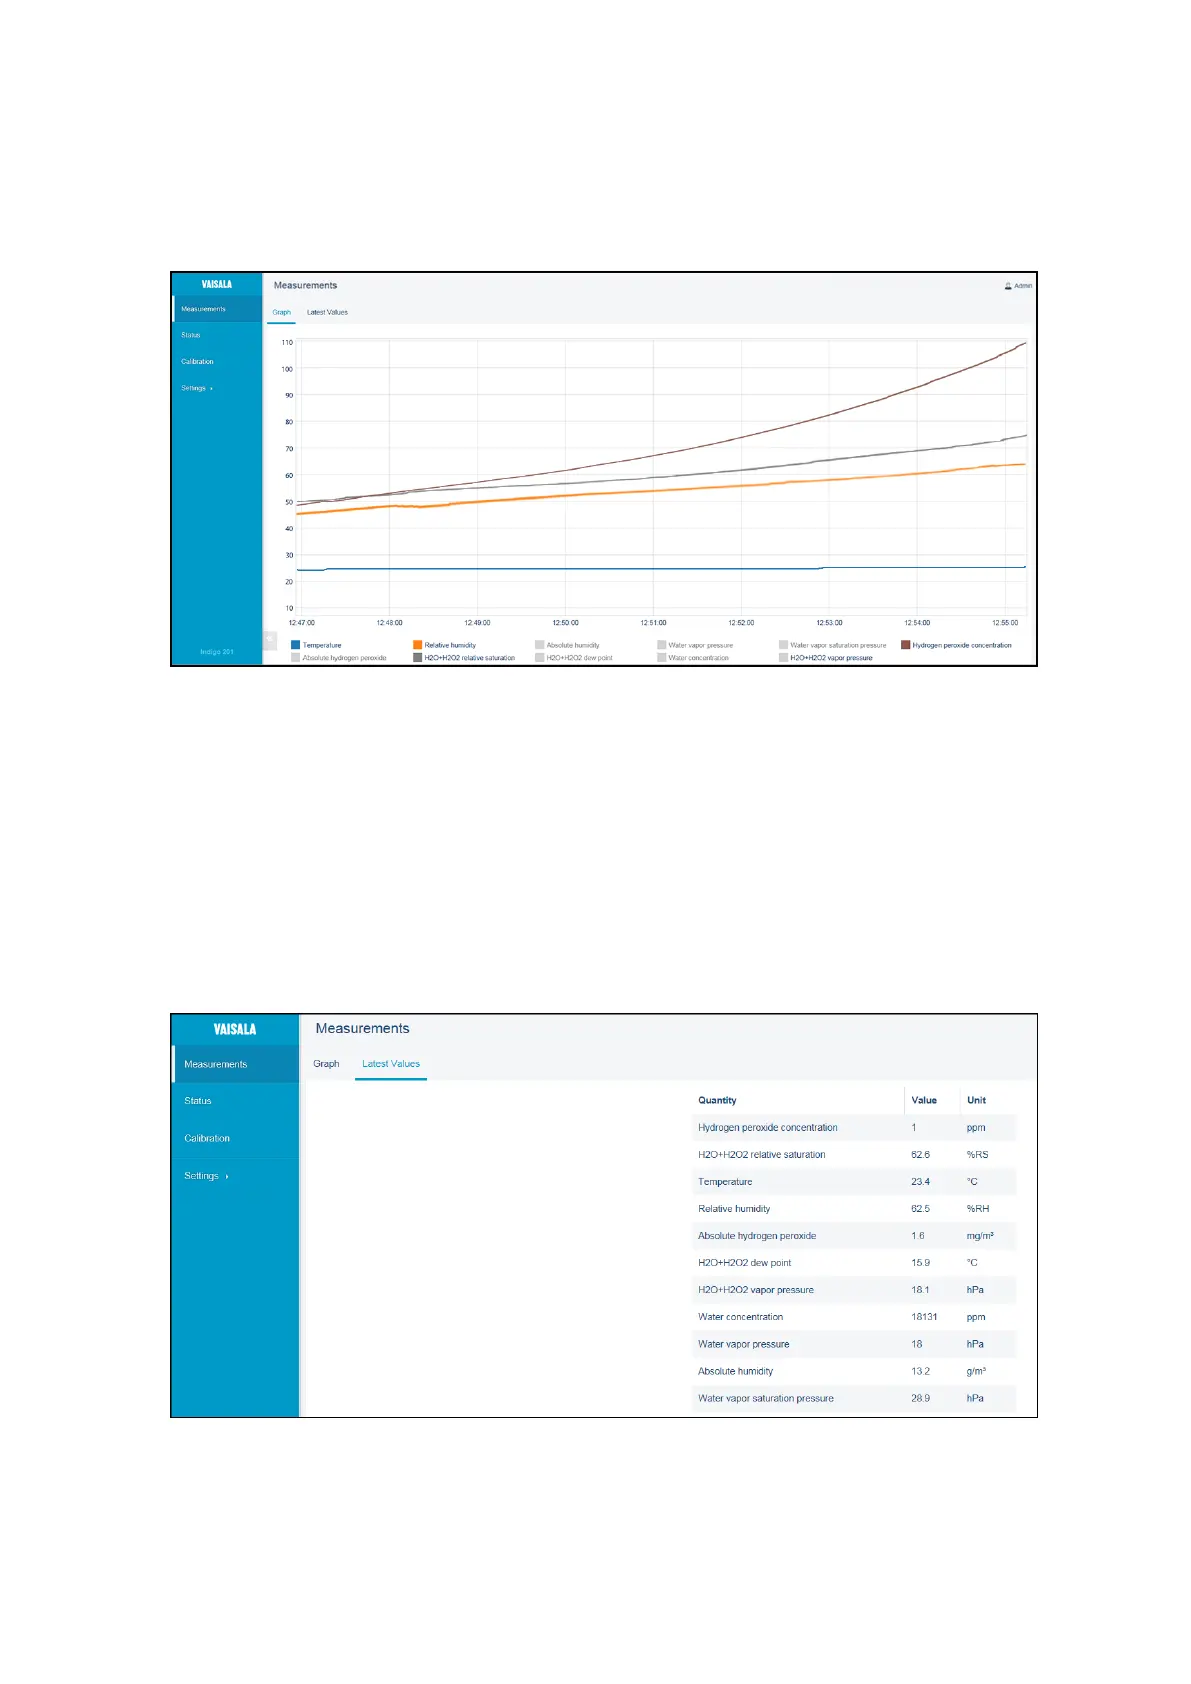
The Measurements view shows the measurement data from the connected probe in numeric
and graph format. When you log in to Indigo, the wireless interface opens in this view.
There are 2 tabs in the Measurements view: Graph and Latest values. The Graph tab is the
initial view that shows the measurement information of the connected probe in graph
format. You can hide and show the graphs of available measurements by selecting the
parameter. The Latest values tab shows the most recent measurement of each available
parameters in numeric format.
Figure 19 Latest Values Tab, H
2
O
2
Probe Example (Desktop Browser)
Chapter 4 – Wireless Configuration Interface
31