The rows in the table show individual days when the flock was weighed. The histogram for the selected day is
displayed in the lower half of the panel for the highlighted row. Individual weights weighed for this day will be
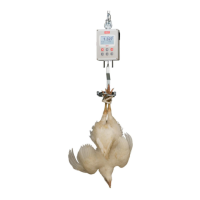
displayed after clicking the Weights tab. Select the Graphs tab to monitor the flock progress in a graphic form.
The horizontal axis specifies the flock age and the vertical axis specifies the average weight of the flock.
8.7.1. Growth curve comparison
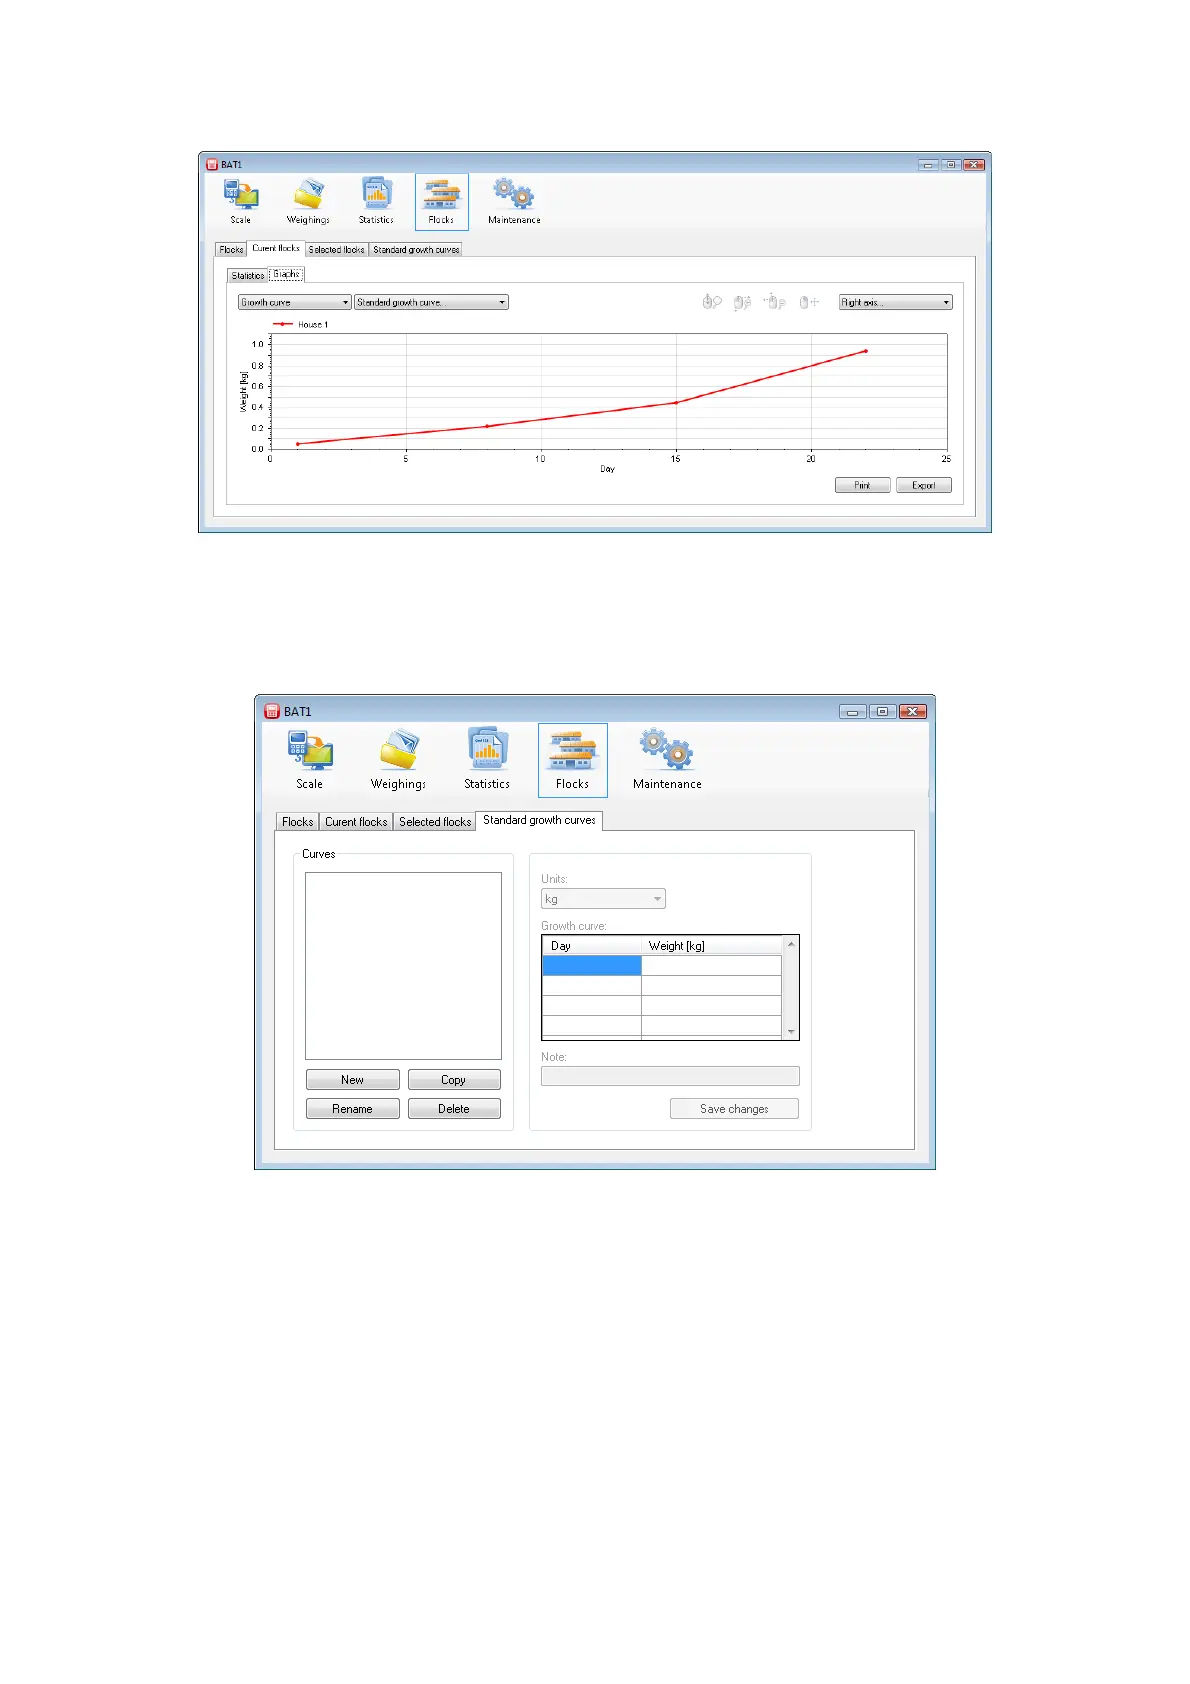
The actual growth curve of the flock can be compared with a standard weight curve. To define the standard
growth curve select the Standard growth curves tab.
Click the New button and enter the name of the growth curve. Select OK and the new growth curve will be
included in the list of curves. Now fill in the age and weight. After filling the table, save the data by clicking the
Save changes button.