Using the LabQuest
®
App
34 Vernier Software & Technology
Model
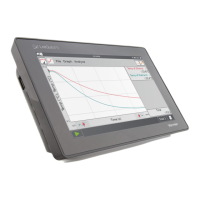
The Model tool manually fits a chosen function to your data.
From the Graph screen, choose Model from the
Analyze menu. Enable the tool by tapping on the
displayed sensor or column name.
Choose the desired model equation from the Model
Equation list. LabQuest displays the modeled function
in the preview graph.
The model parameters (e.g., A, B, and C) are
adjustable. Change them by direct entry or by using
the + and – buttons. Use the Δ tool to modify the
difference associated with the buttons.
Tap OK to display the modeled function on the Graph
screen. To exit the Model tool without applying the
function, tap Cancel.
TIP! If no function appears on the graph when modeling, your parameters are likely defining a
curve that is outside of the plot window.
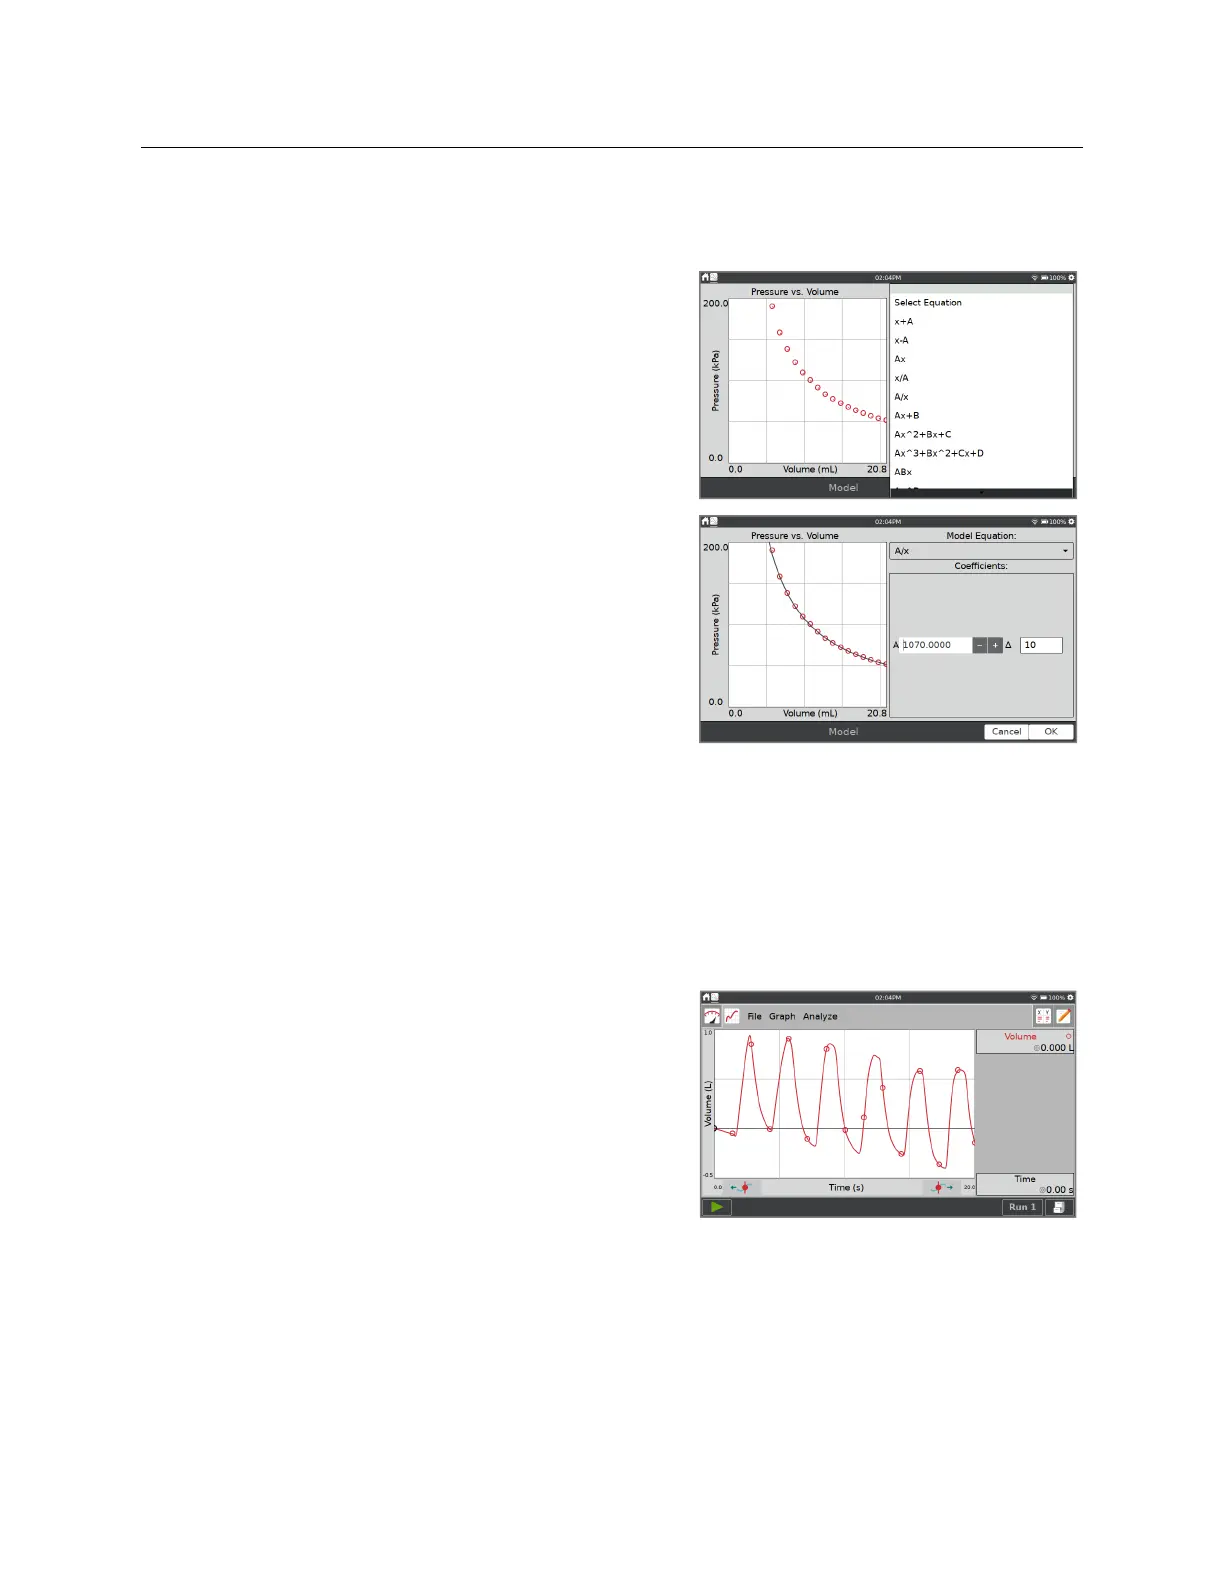
Baseline Adjustment
This tool is used when analyzing spirometer data. For a series of breathes, the volume data from
each breath should increase and then decrease, returning close to zero for each breath cycle.
In some cases, the baseline drifts making it so that
volume appears to increase or decrease by a given
amount for each breath. The baseline adjustment
applies a factor to compensate for this error.
Because LabQuest App uses the x-axis as its baseline
when calculating an integral, adjusting the baseline
can result in better lung volume measurements.