LabQuest
®
3 User Manual
www.vernier.com/labq3 37
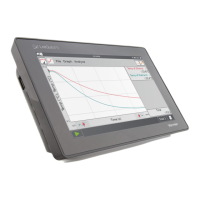
When you are done, tap OK to view the peak data in
the Plot Details, where you can see the full table of
data.
Pivot Data
Pivot Data is only available when the data-collection mode is set to Data Matrix mode. A typical
setup of the data matrix is to have the testing sites be the independent variable, and the days you
test be in different datasets.
Pivot Data transposes the independent variable with
the data sets, so you can view the daily data as the
location changes or pivot the data and view the
location data as the day changes.
From the Graph screen, choose Advanced from the
Analyze menu and select Pivot Data to activate this
tool.
Alternatively, from the Table screen, choose Pivot
Data from the Advanced menu.
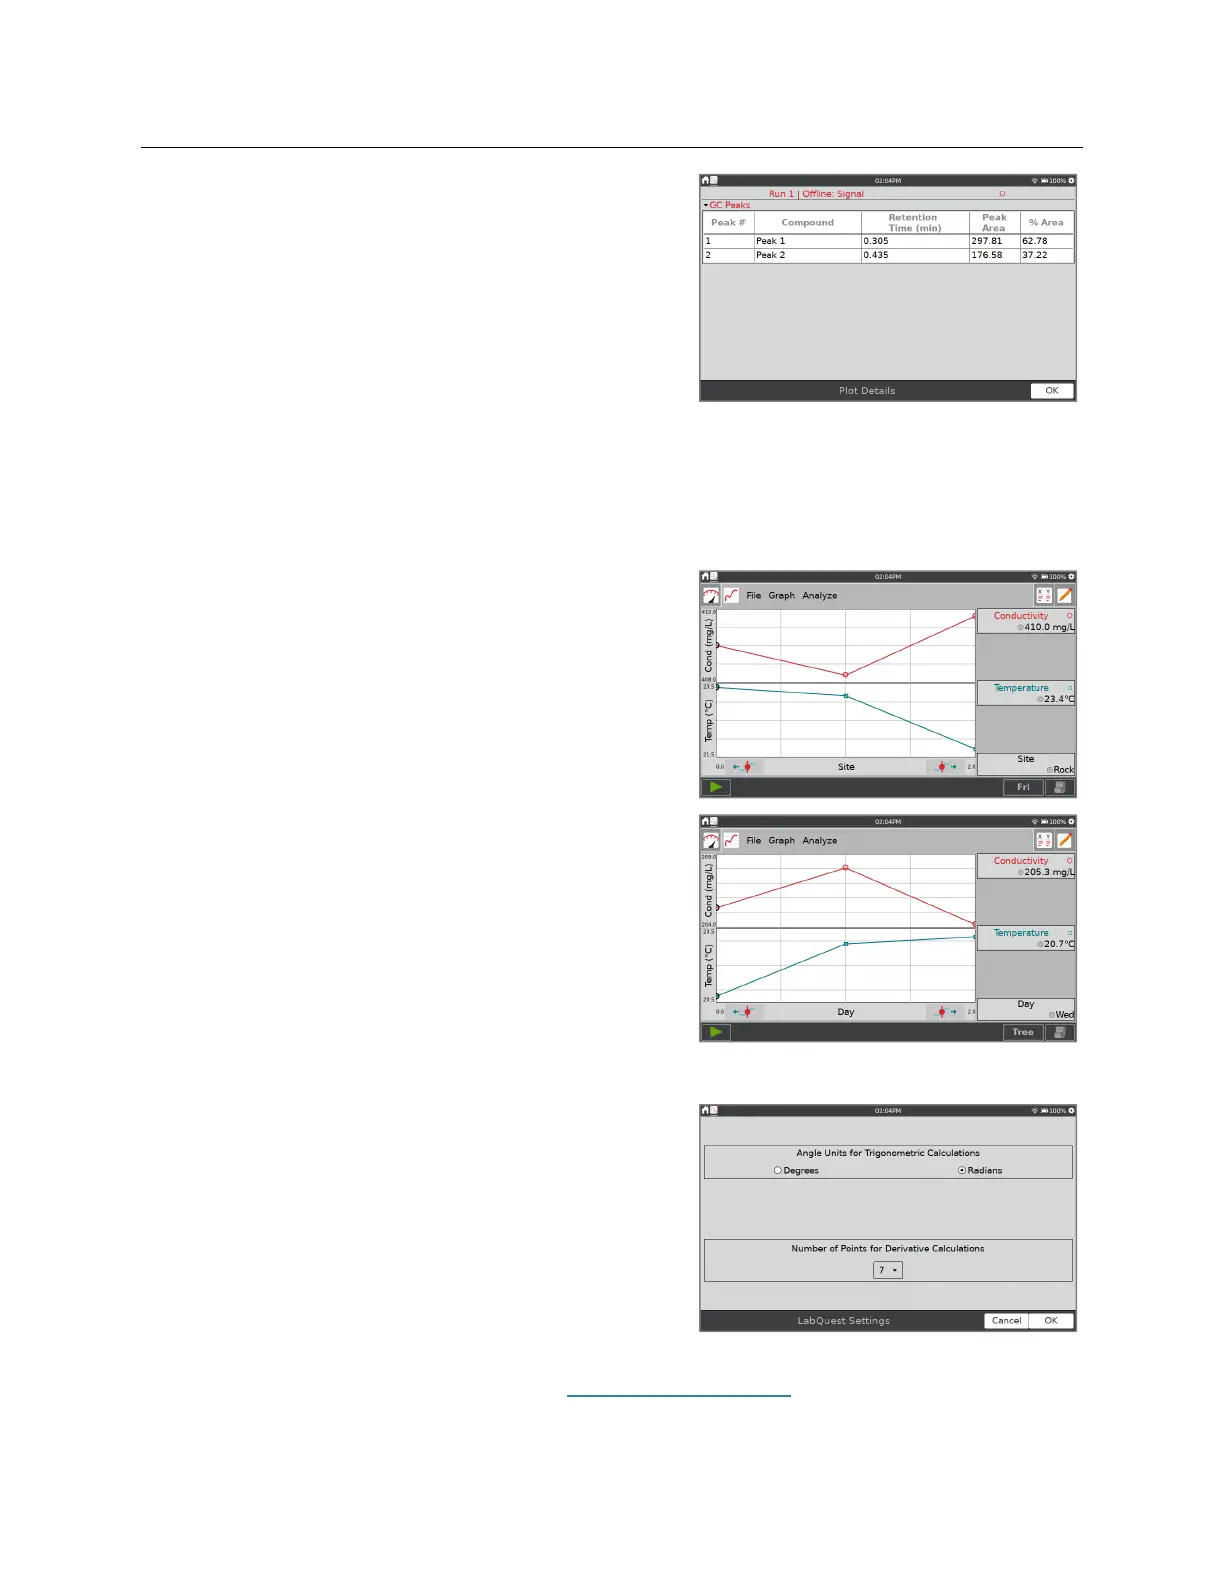
Settings for LabQuest App Files
Trigonometric and derivative calculations used in
calculated columns, curve fits, and models include
settings you can control.
Select Settings from the File menu to access the
LabQuest Settings.
Angle Units for Trigonometric Calculations
Number of Points for Derivative Calculations
For more information on these settings, see LabQuest App Settings.