2-10 Preparing for operation
Defining the gradient
The gradient table controls solvent flow and composition during each sample
run. The Curve column indicates the gradient curve’s profile.
Example: The curve specified in row 2 runs in the interval between gradient
event 1’s initial conditions and gradient event 2’s initial conditions.
To define the gradient:
1. In the Modify Instrument Method > Chromatographic Pump > Mobile
Phase tab, enter the gradient event 1 information in the table in the
lower portion of the Modify Instrument Method screen.
2. In the first row of the Flow column, enter the solvent flow rate at the
start of the run.
3. You can enter either %A or %B. In the %A or %B column, enter the
percent solvent at the start of the run.
Range: 0 to 100% in 0.1% increments.
The software automatically calculates the other % composition so that
%A plus %B equals 100%.
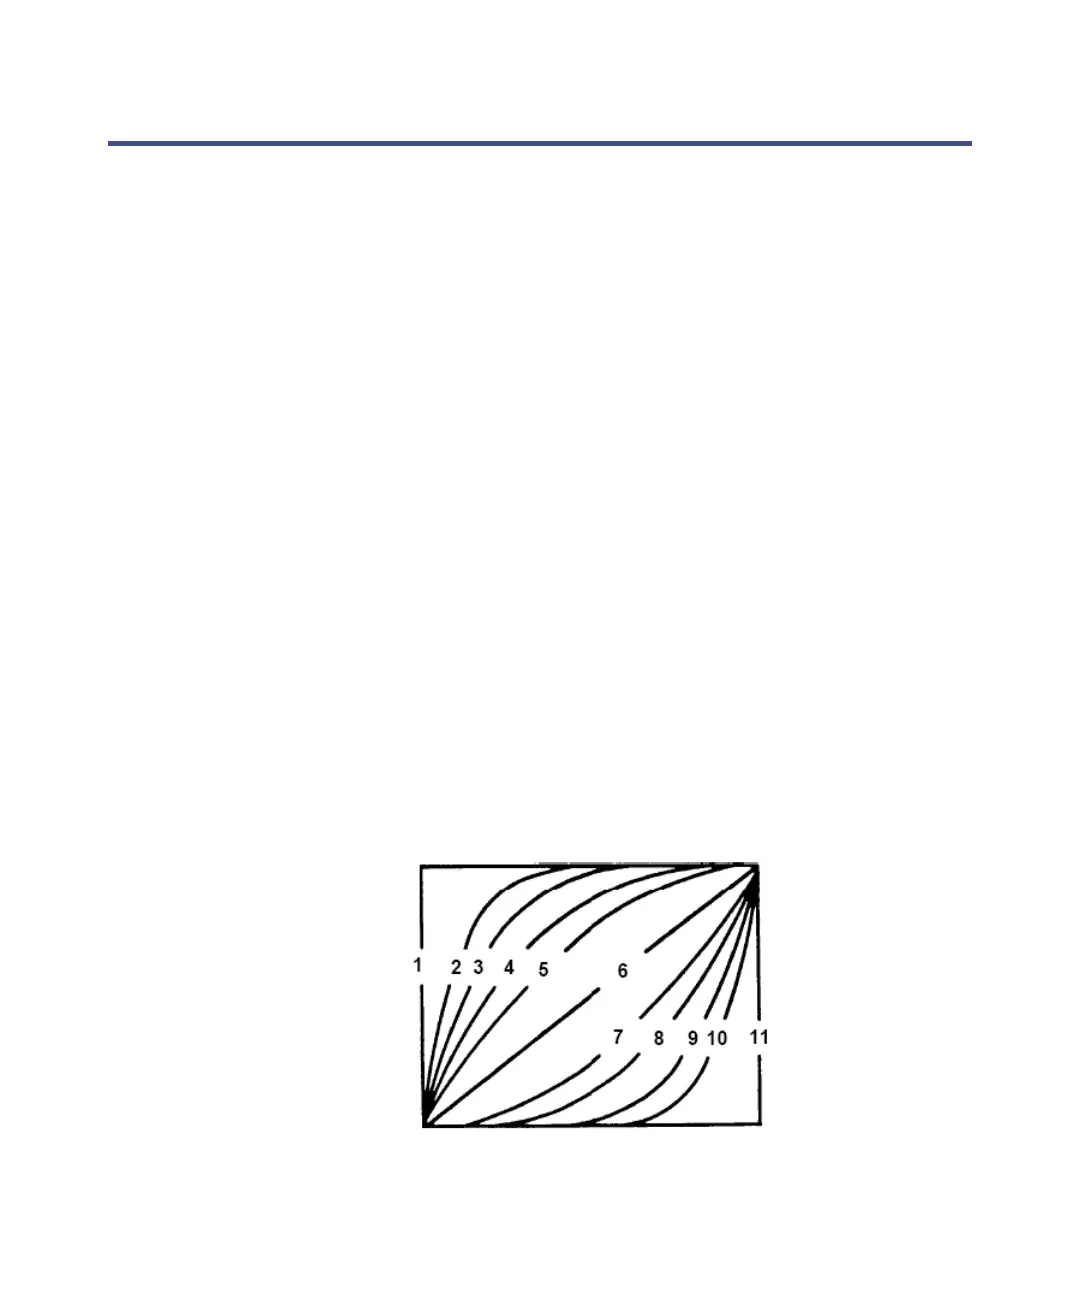
4. In the Curve column, enter the gradient curve profile. Curve profiles can
indicate a change in conditions at start (1), a convex curve (2 through 5),
linear (6), a concave curve (7 through 10), or a change to final conditions
at end (11).
Gradient curve profiles
Final conditions
Initial conditions
Start time
End time