<6. OPERATION OF SC (Conductivity)>
6-10
IM 12A01A02-01E 8th Edition : Oct. 01, 2015-00
Read Logbook:
logbook1-1
Memorandum:
Item
Sensor washed by hand
Enter?
No
logbook1-1 1/1
Memorandum:
Item
Sensor replaced
Enter?
No
2010/02/15 17:04
Sensor replaced
2010/02/15 15:15
Power on
Finish
2010/02/15 15:15
Power on
Finish
logbook1-1 1/1
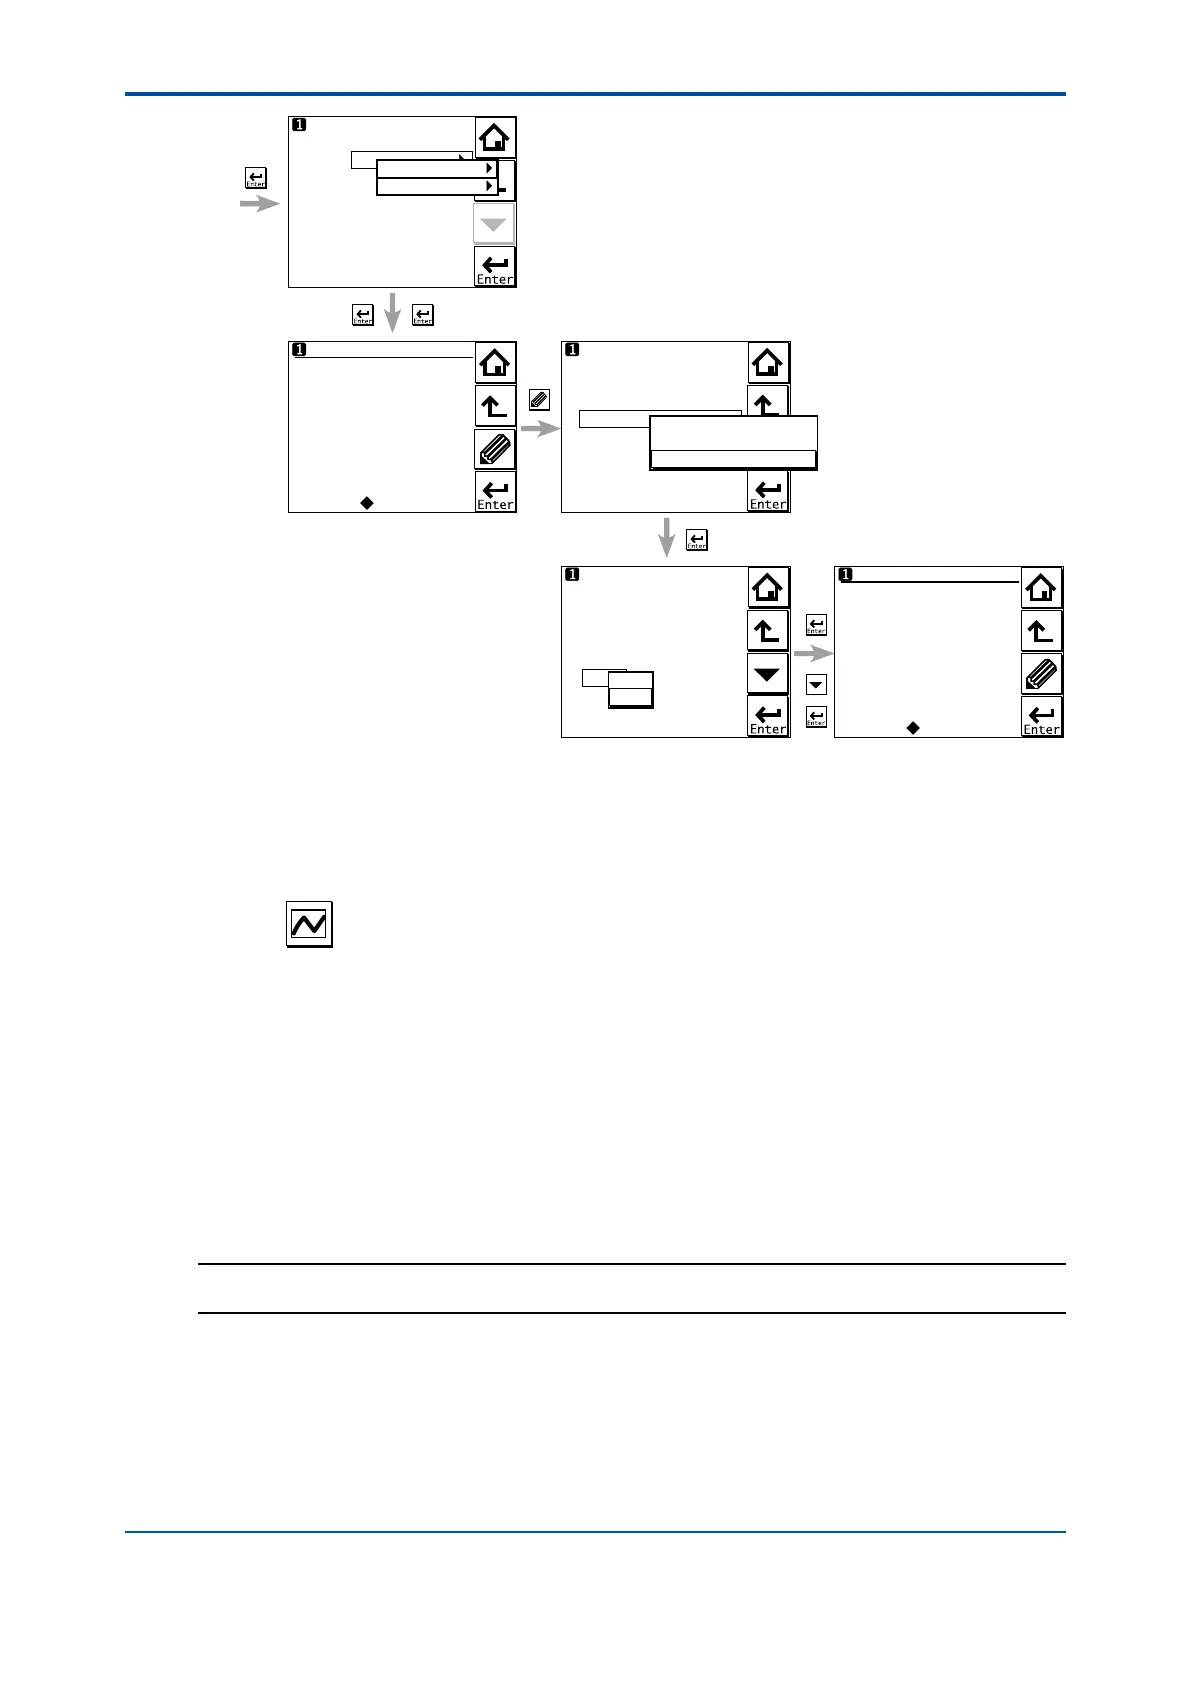
** When storing message manually.
**
(Fig.6.6)
Sensor washed by hand
Module replaced
Sensor replaced
logbook1-1
logbook1-2
No
Yes
Figure 6.8 Detail display (continued)
6.5 Trend graphics
Pressing on the Zoom display changes the display to a graphical mode in which the
average measured value is shown on a time scale. The “Live” value is also digitally displayed in
a text box. The time scale (X-axis) and the primary value scale (Y-axis) are set in the “DISPLAY
SETUP” menu (Section 7.7.2).
The screen displays the trend of up to 41 averages of the measurement for each time interval.
The FLXA202/FLXA21 samples the measurements every second. The trending graphic also
shows the maximum and minimum measured values in that interval.
For example, if the time scale is set to 4 hours, then the trend is shown for 4 hours prior to the
actual measurement. Each point on the trend line represents the average over 4×60×60/41 =
351 measurements (seconds).
NOTE
Updating the trend screen setup resets the current trend graph and starts a new one.
 Loading...