<9. Calibration>
9-3
IM 11M12A01-04E 11th Edition : Jul. 19, 2017-00
From the above equations (1) and (2), we obtain:
E = -K log y/a = -Klog [(100 – x) 30.21] /21
= - K log (1 –0.01 x) ……………… Equation (3)
where, K = Constant
Using the above equation (3), we can calculate the water vapor in vol % from the electromotive
force.
Sample gas
Comparison
water vapor
+
-
H
2
O
concentration
indicator
Electrode
Water vapor
100%
Air
100%
100%
H
2
O
79%
21%
O
2
N
2
y%
x%
Sample gas composition
Zirconia element
F9-1E.ai
Figure 9.2 Schematic Diagram of Measurement Principle
(B) For the “mixing ratio” measurement
Assuming that the mixing ratio is rkg/kg, then “r” can be calculated from the value of H
2
O vol % as
follows:
r = 0.622 3 x/(100 – x) …………… Equation (4)
From the above equations (1), (2) and (4), we obtain:
E = -K log y/a = -K log 50.622 3 21/(0.622 + r)/216
= -K log 0.622/(0.622 + r) … …… Equation (5)
where, K = Constant
With Equation (5), we can obtain the mixing ratio rkg/kg from the electromotive force.
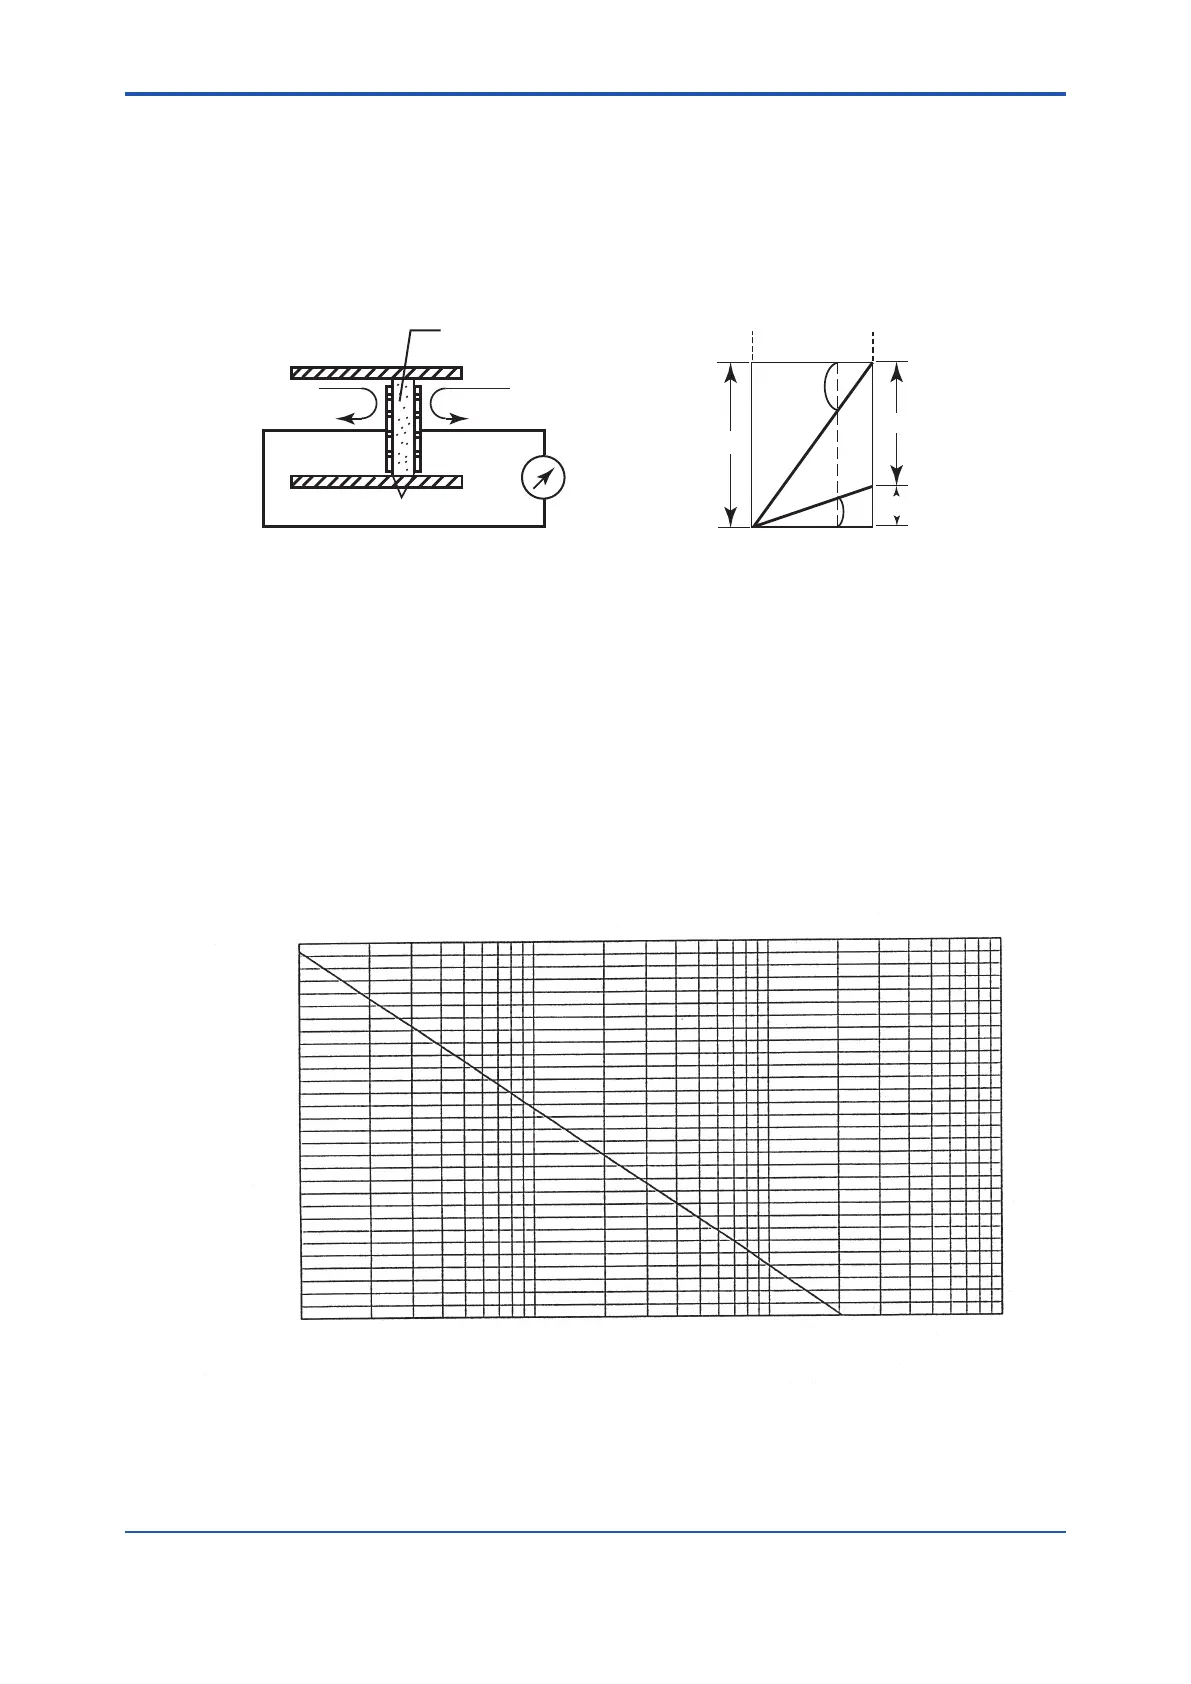
120
100
80
60
40
20
0
0.1
1
10 100
Cell output, mV
E = -50.74 log PX/20.6
Oxygen concentration vs. cell output
Oxygen concentration PX (%O
2
)
F9-2E.ai
Figure 9.3
 Loading...