Manual Power Quality Filter PQFS Commissioning instructions 87
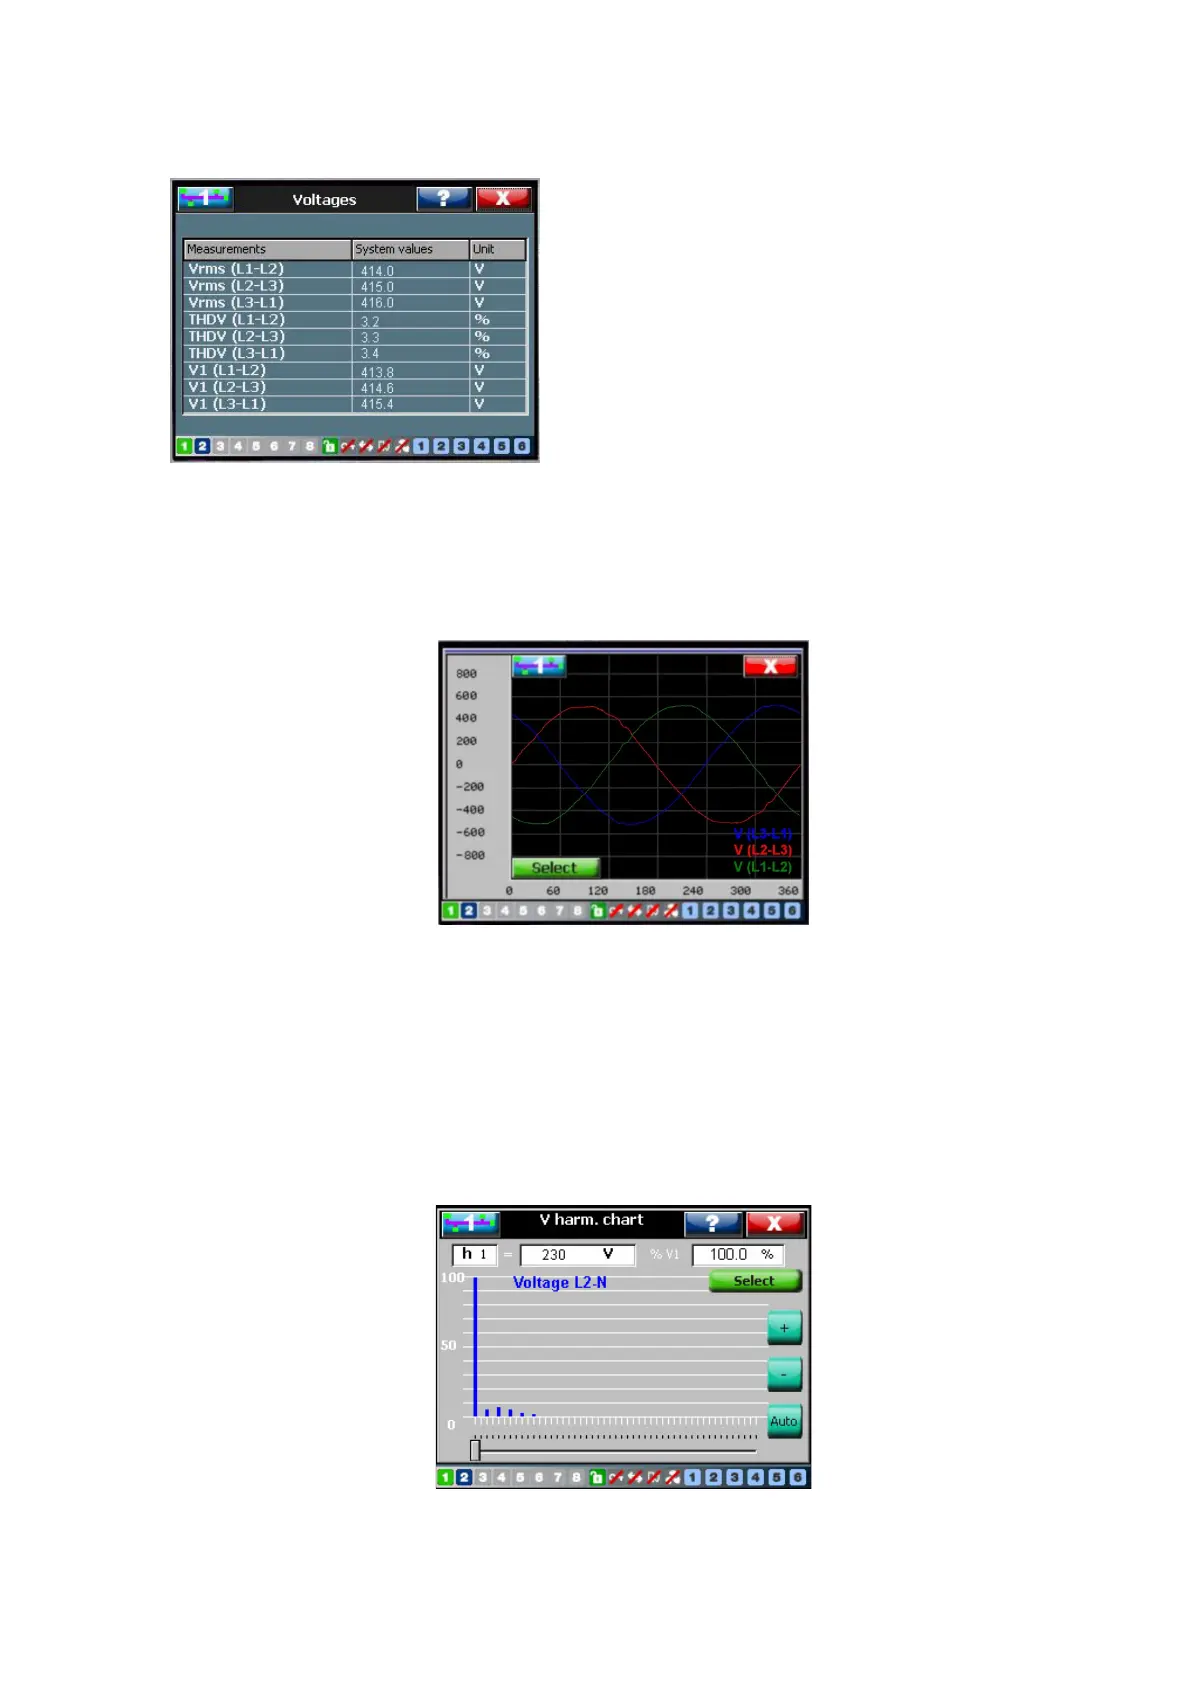
7.8.2.1.1 Global values
Vrms, V1 and THDV in table format.
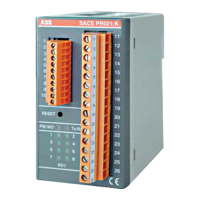
7.8.2.1.2 Waveforms
The network voltage waveforms for all phases (Figure 60). All waveforms are
synchronized with the rising edge zero crossing of the voltage V (L1-N) (4-W mode) or V
(L1-L2) (3-W mode).
Figure 60: Time domain waveform of line voltage displayed by the PQF-Manager (3-W mode
example)
7.8.2.1.3 Spectrum
The network voltage spectrum for all phases in chart format (Figure 61). The spectral
components up to the 49
th
order are expressed as a % of the fundamental component
with absolute values also shown in the top right corner. The two buttons with “+” and “-
“ mark help changing the voltage level resolution (i.e. Y-axis value in the chart).
Figure 61: Spectrum of the network voltage in chart format displayed by the PQF-Manager (4-W
mode example)